Observability
Observability is a measure of how well internal states of a system can be inferred from knowledge of its external outputs. In the context of a software system, observability is the ability to understand the internal state of the system by examining its outputs. This is important for debugging, monitoring, and maintaining the system.
Observability In DB-GPT
DB-GPT provides observability through the following mechanisms:
- Logging: DB-GPT logs various events and metrics to help you understand the internal state of the system.
- Tracing: DB-GPT provides tracing capabilities to help you understand the flow of requests through the system.
Logging
You can configure the logging level and storage location for DB-GPT logs. By default,
logs are stored in the logs directory in the DB-GPT root directory. You can change
the log level and storage location by setting the DBGPT_LOG_LEVEL and DBGPT_LOG_DIR environment.
Tracing
DB-GPT has built-in tracing capabilities that allow you to trace the flow of requests through the system.
Trace Storage
Local Storage
DB-GPT will store traces in the traces directory in the DB-GPT logs directory, by default,
they are located in logs/dbgpt*.jsonl.
If you want to know more about the local storage of traces and how to use them, you can refer to the Debugging documentation.
OpenTelemetry Support
DB-GPT also supports OpenTelemetry for distributed tracing. Now, you can export traces to open-telemetry compatible backends like Jaeger, Zipkin, and others with OpenTelemetry Protocol (OTLP).
To enable OpenTelemetry support, you need install following packages:
pip install opentelemetry-api opentelemetry-sdk opentelemetry-exporter-otlp
Then, modify your .env file to enable OpenTelemetry tracing:
## Whether to enable DB-GPT send trace to OpenTelemetry
TRACER_TO_OPEN_TELEMETRY=True
## More details see https://opentelemetry-python.readthedocs.io/en/latest/exporter/otlp/otlp.html
OTEL_EXPORTER_OTLP_TRACES_ENDPOINT=http://localhost:4317
In the above configuration, you can change the OTEL_EXPORTER_OTLP_TRACES_ENDPOINT to
your OTLP collector or backend, we use gRPC endpoint by default.
Here, we use Jaeger as an example to show how to use OpenTelemetry to trace DB-GPT.
Jaeger Support
Here is an example of how to use Jaeger to trace DB-GPT with docker:
Run the Jaeger all-in-one image:
docker run --rm --name jaeger \
  -e COLLECTOR_ZIPKIN_HOST_PORT=:9411 \
  -p 6831:6831/udp \
  -p 6832:6832/udp \
  -p 5778:5778 \
  -p 16686:16686 \
  -p 4317:4317 \
  -p 4318:4318 \
  -p 14250:14250 \
  -p 14268:14268 \
  -p 14269:14269 \
  -p 9411:9411 \
  jaegertracing/all-in-one:1.58
Then, modify your .env file to enable OpenTelemetry tracing like above.
TRACER_TO_OPEN_TELEMETRY=True
OTEL_EXPORTER_OTLP_TRACES_ENDPOINT=http://localhost:4317
Start the DB-GPT server:
dbgpt start webserver
Now, you can access the Jaeger UI at http://localhost:16686 to view the traces.
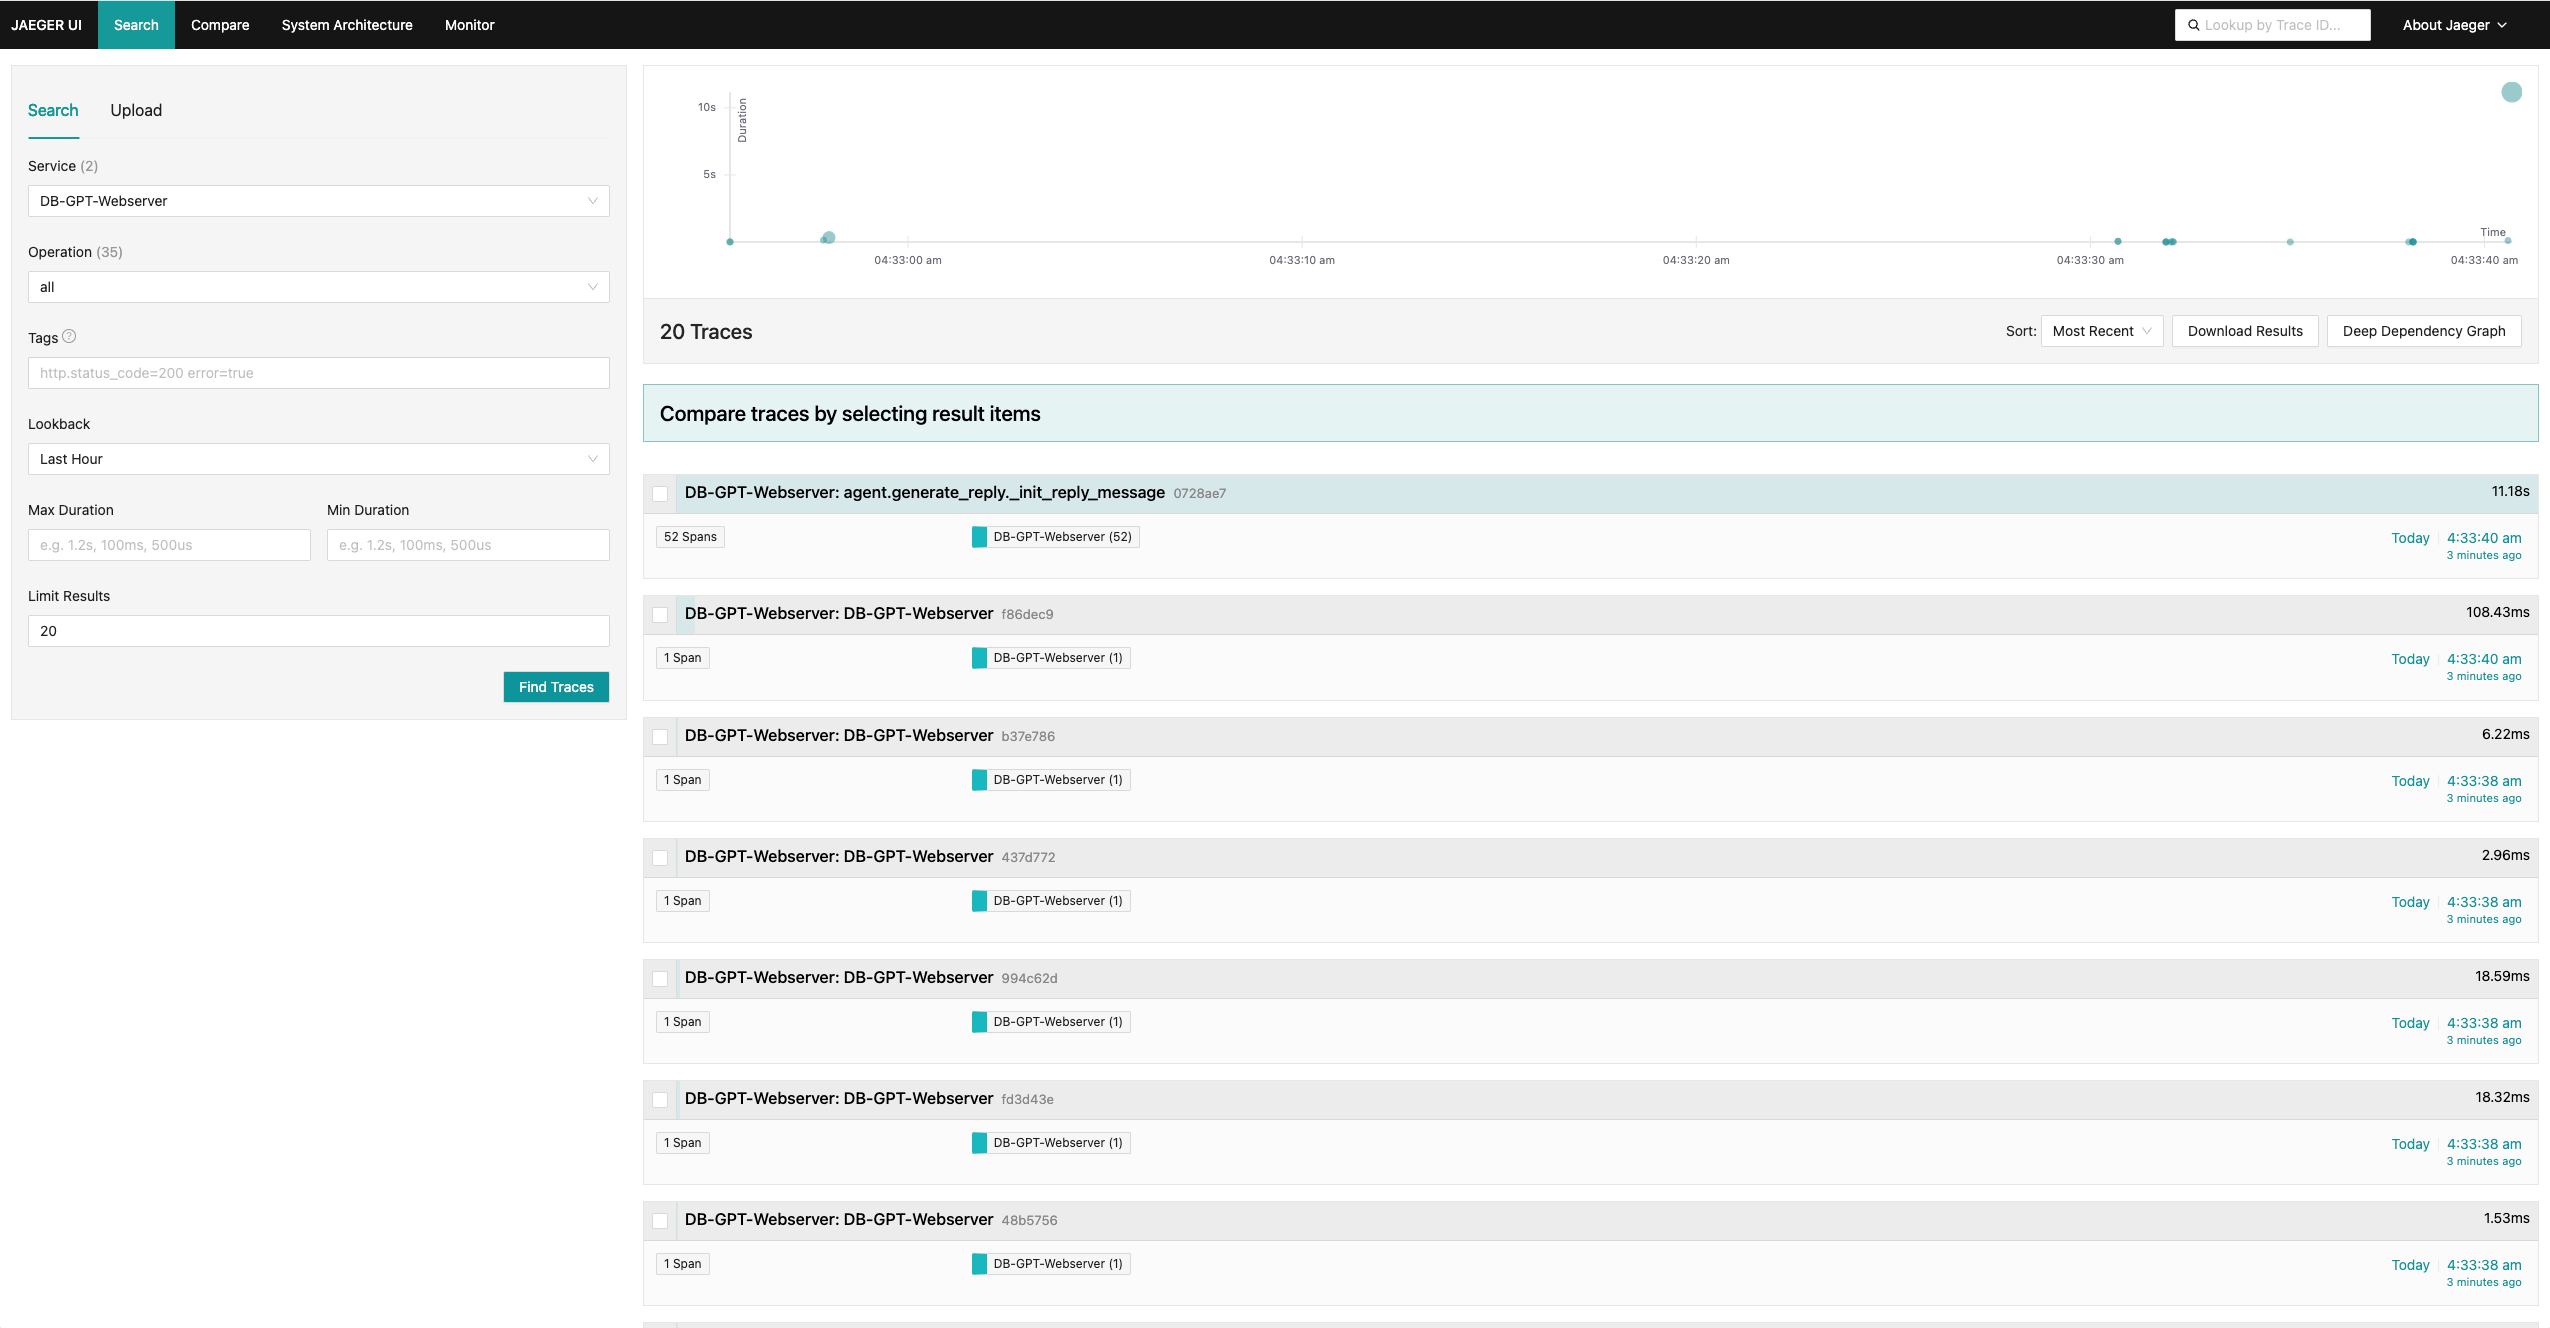
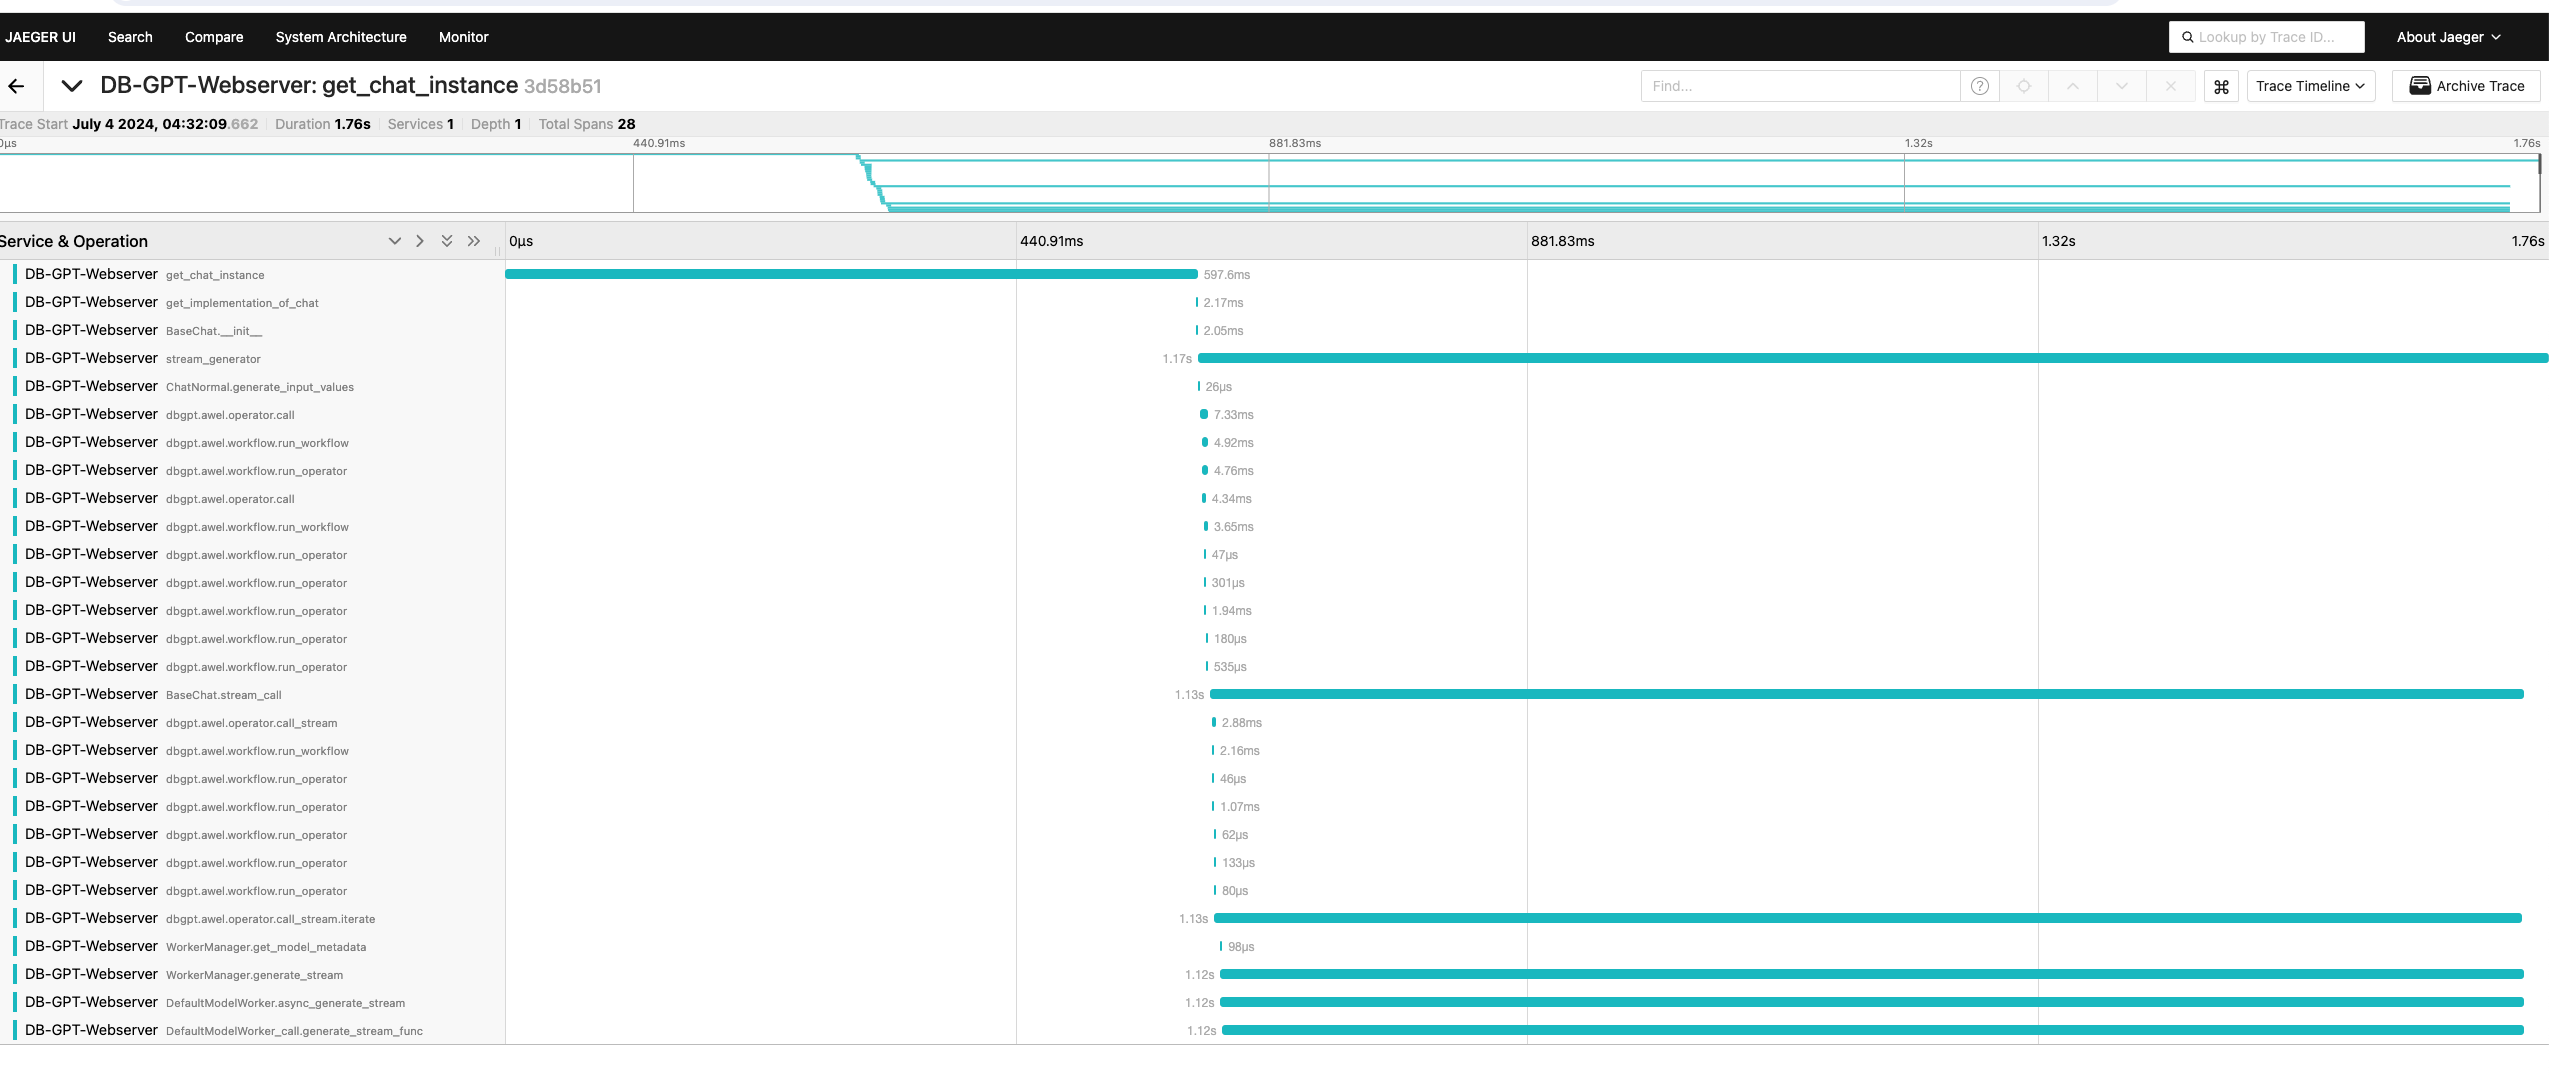
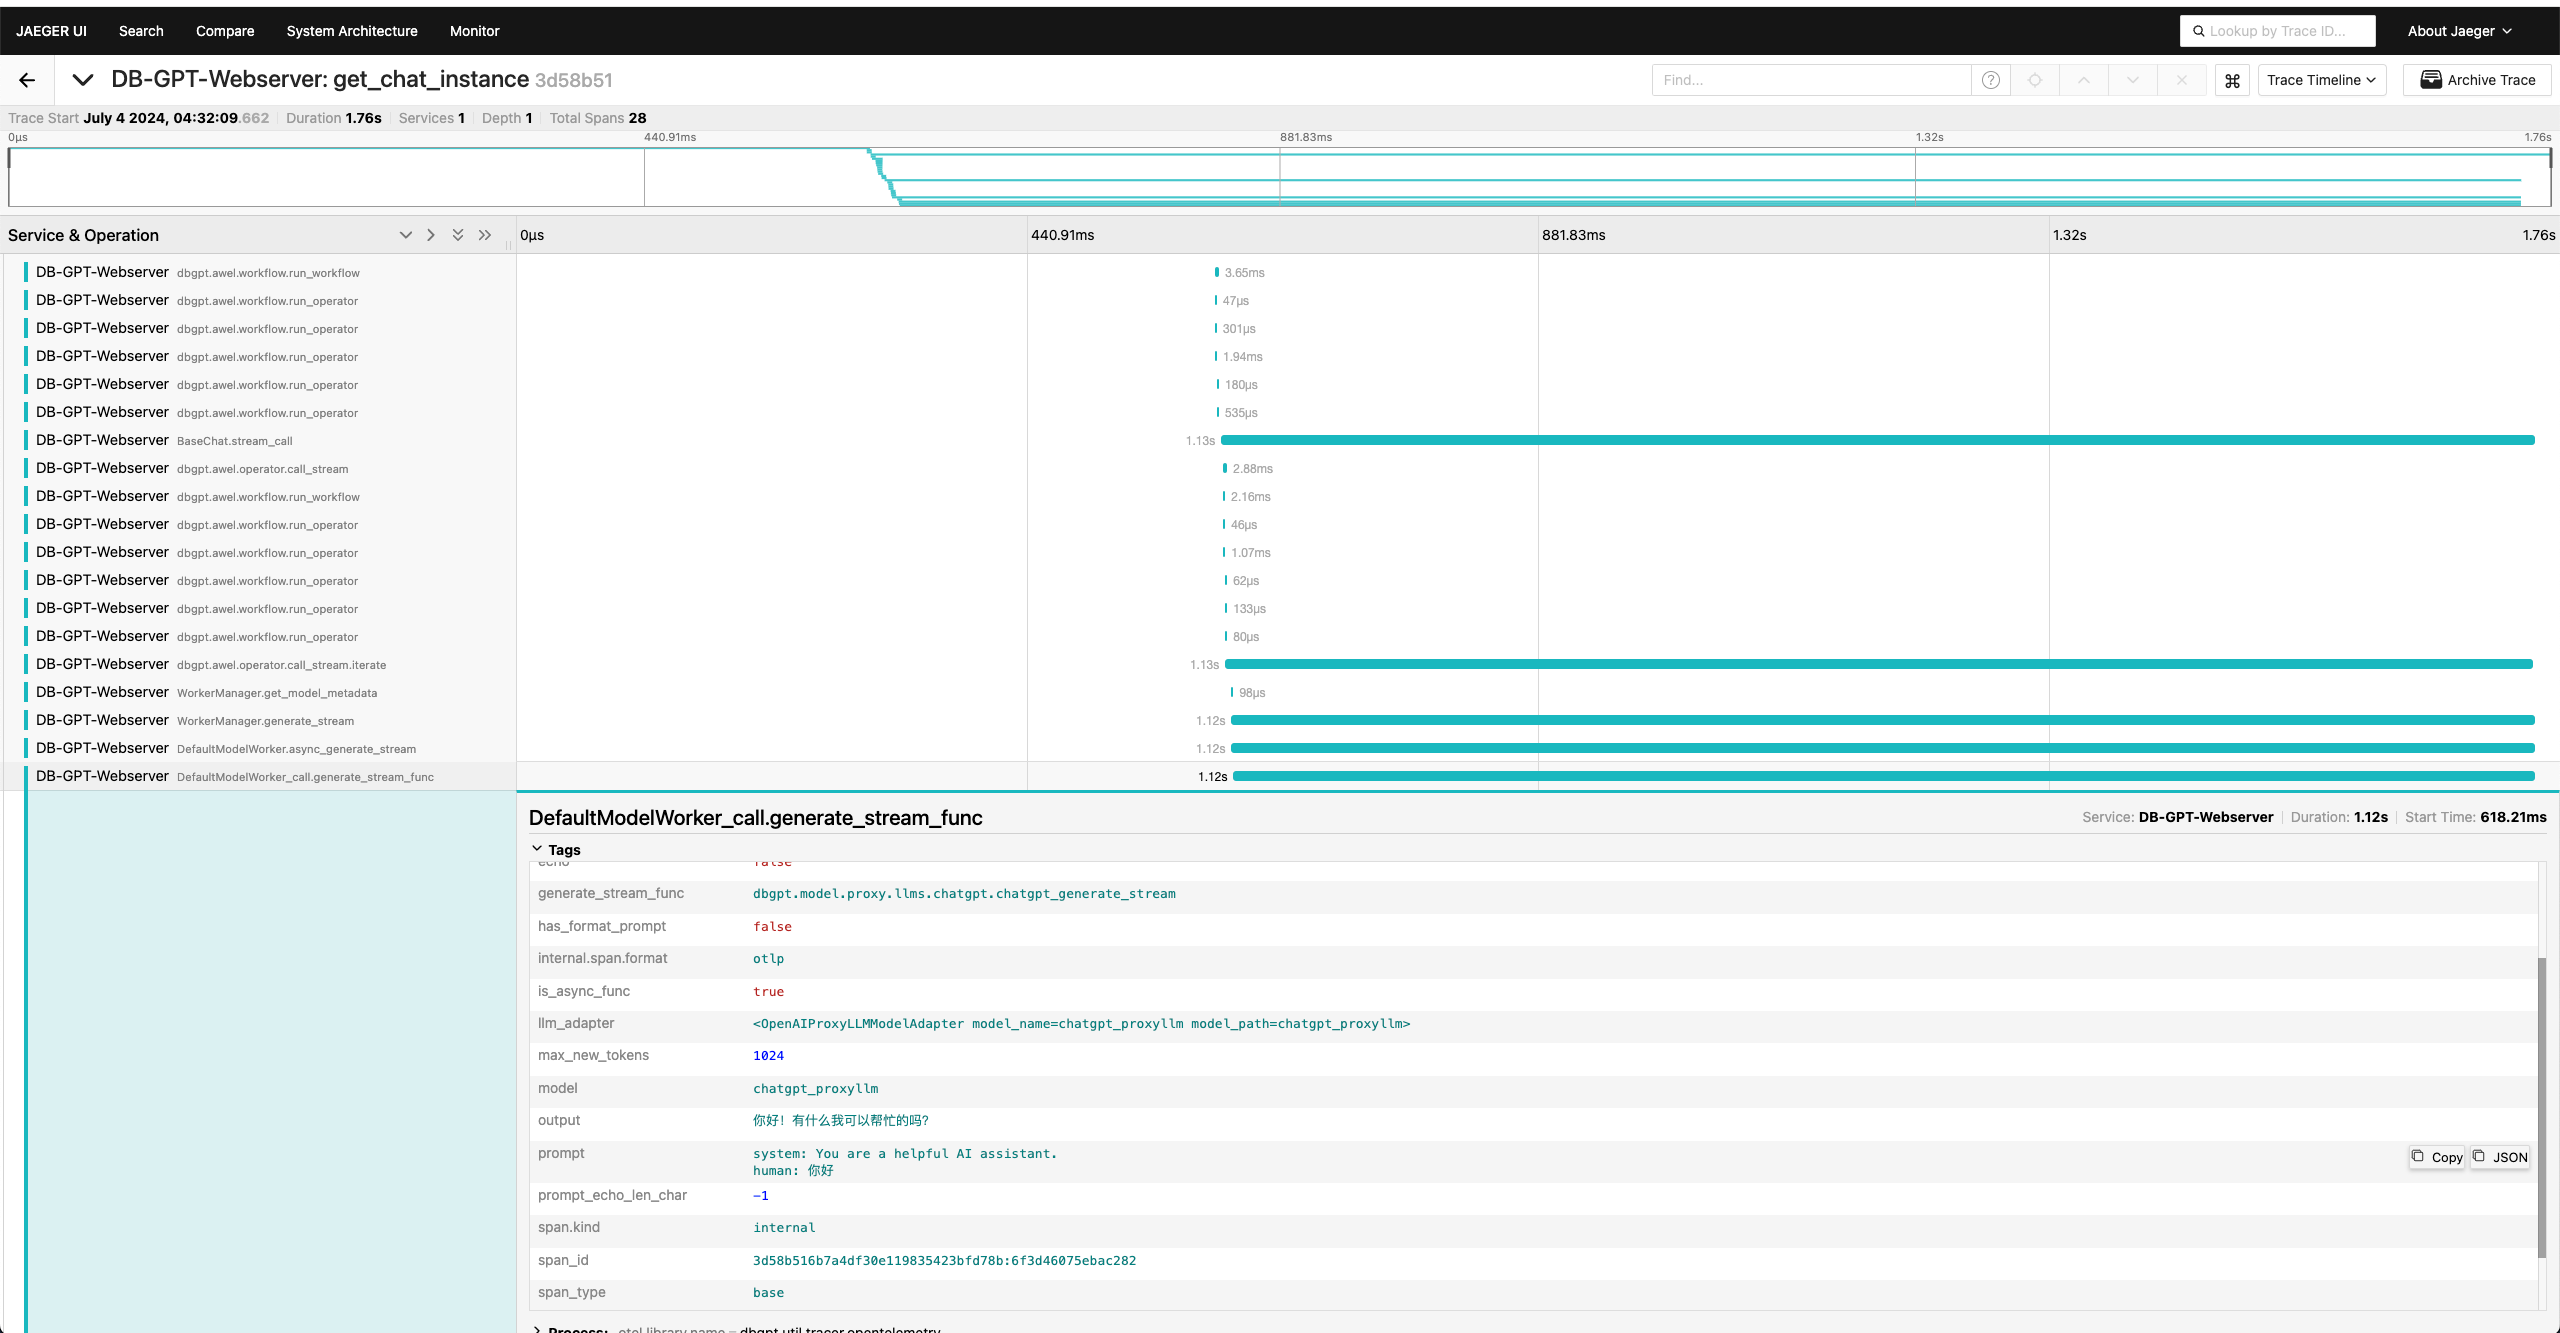
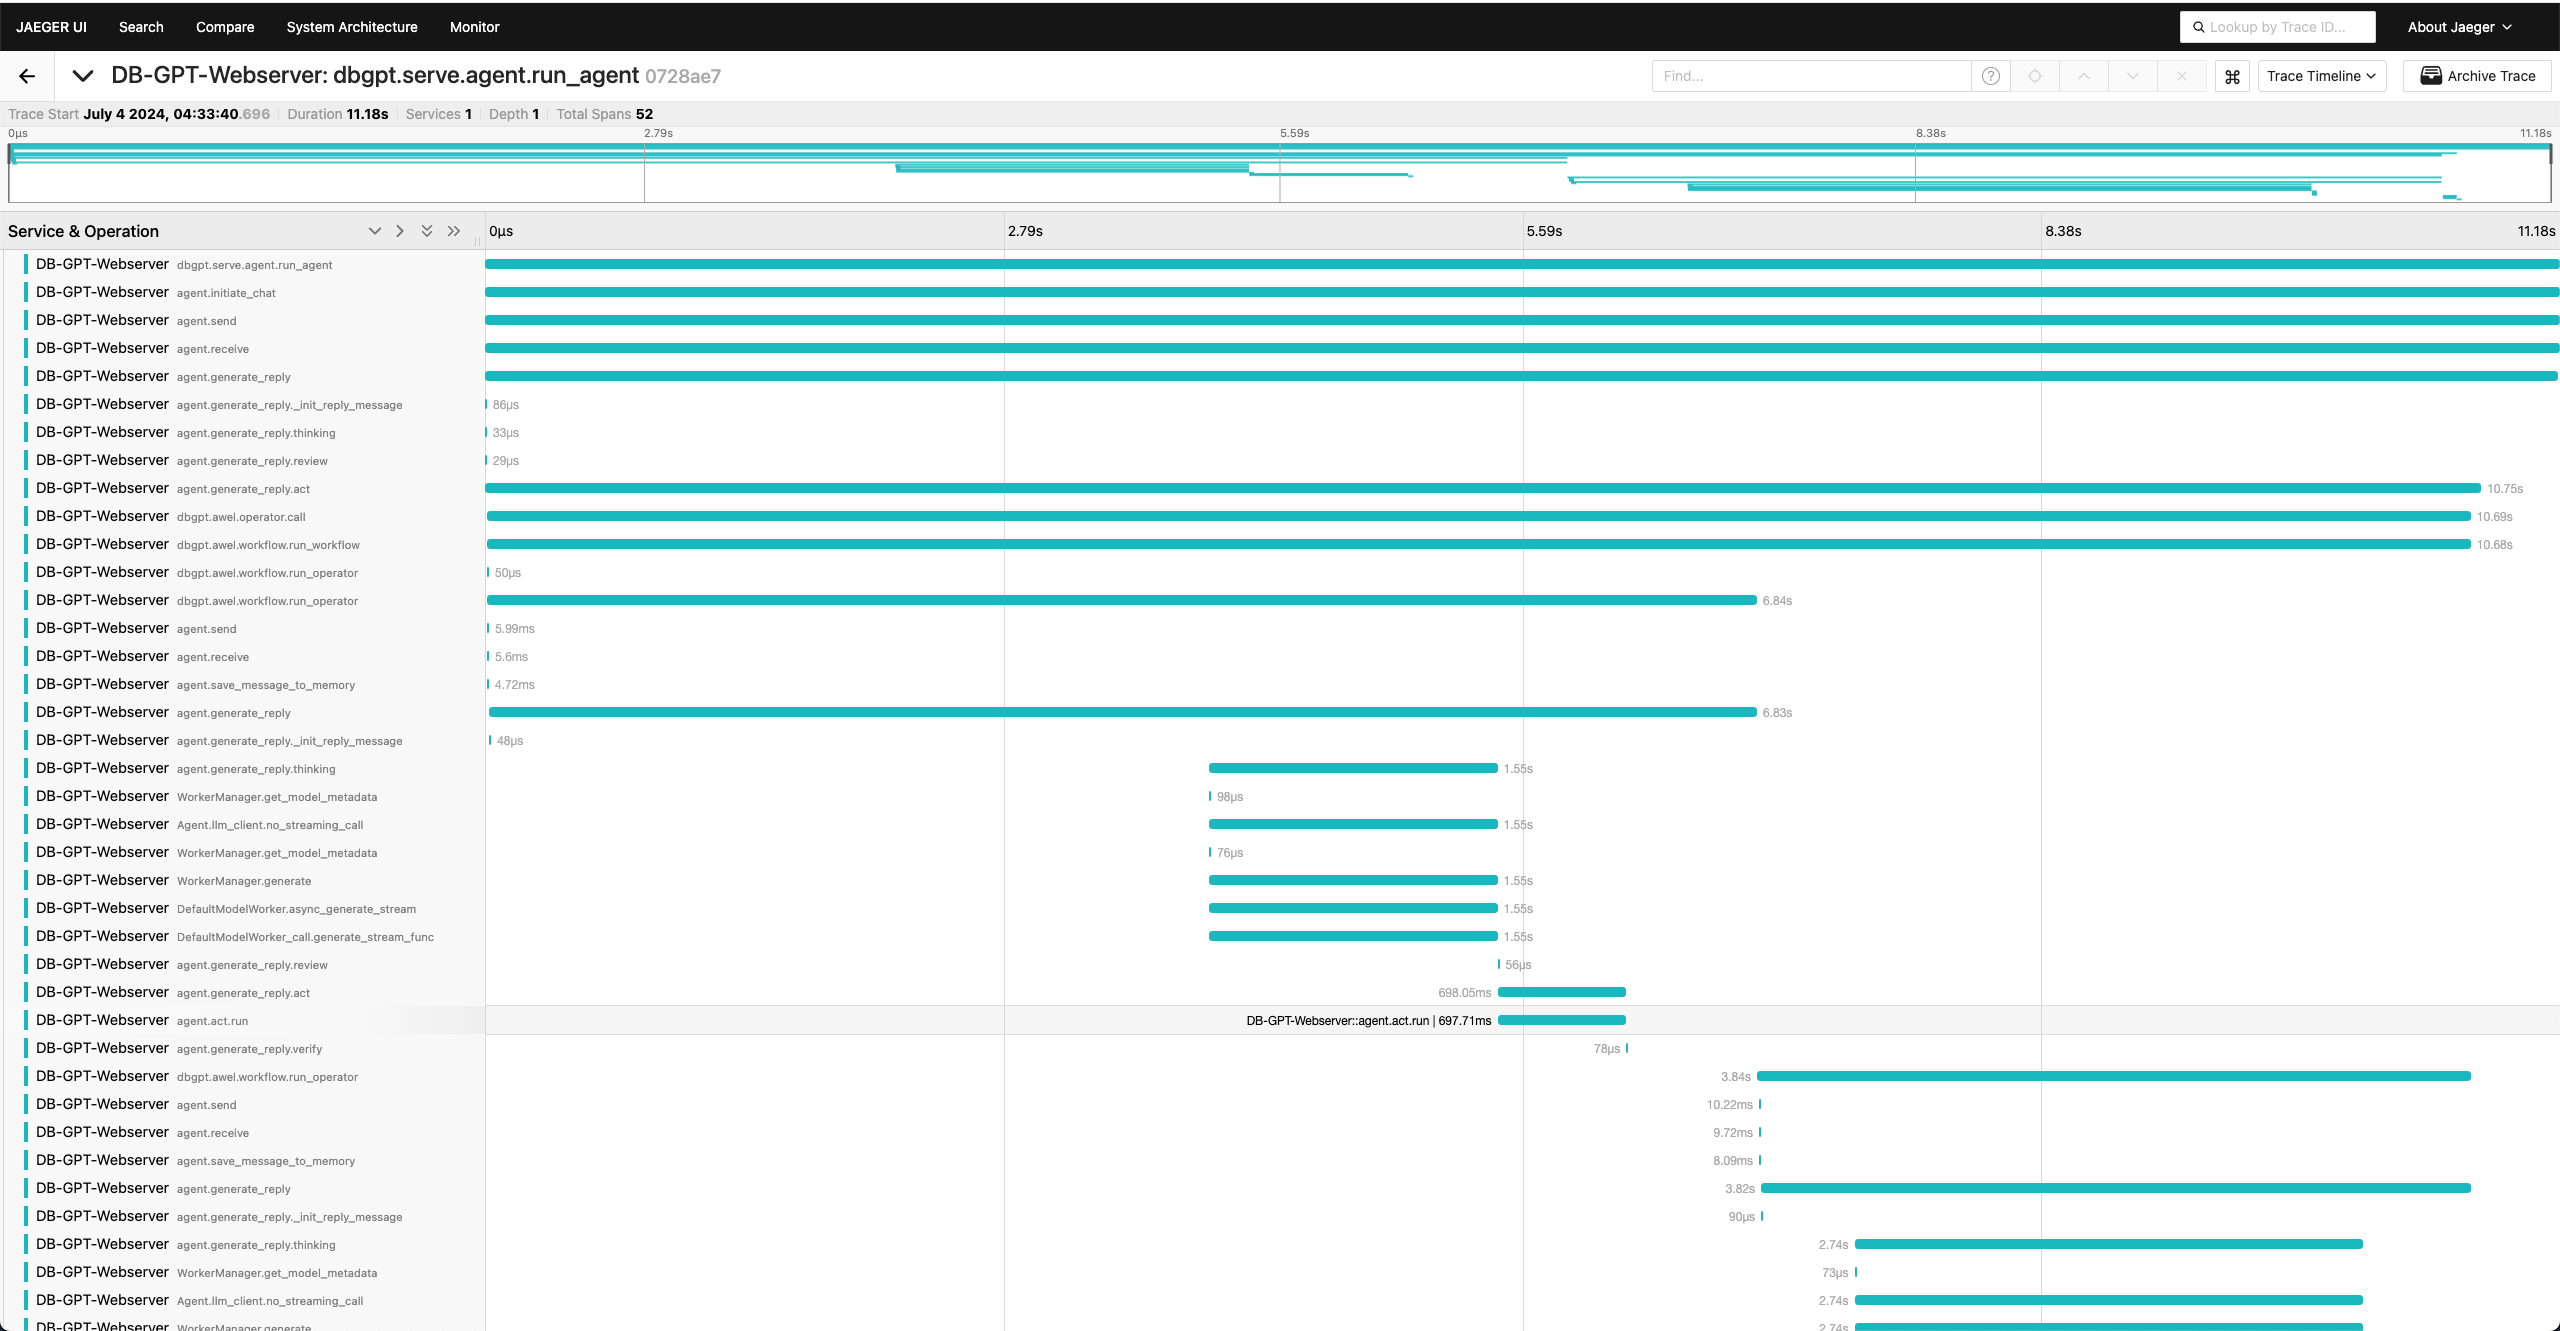
Here are some examples of screenshot of Jaeger UI:
Search Traces Page
Show Normal Conversation Trace
Show Conversation Detail Tags
Show Agent Conversation Trace
Show Trace In Cluster
Jaeger Support With Docker Compose
If you want to use docker-compose to start DB-GPT and Jaeger, you can use the following
docker-compose.yml file:
# An example of using docker-compose to start a cluster with observability enabled.
version: '3.10'

services:
  jaeger:
    image: jaegertracing/all-in-one:1.58
    restart: unless-stopped
    networks:
      - dbgptnet
    ports:
      # serve frontend
      - "16686:16686"
      # accept jaeger.thrift over Thrift-compact protocol (used by most SDKs)
      - "6831:6831"
      # accept OpenTelemetry Protocol (OTLP) over HTTP
      - "4318:4318"
      # accept OpenTelemetry Protocol (OTLP) over gRPC
      - "4317:4317"
      - "14268:14268"
    environment:
      - LOG_LEVEL=debug
      - SPAN_STORAGE_TYPE=badger
      - BADGER_EPHEMERAL=false
      - BADGER_DIRECTORY_VALUE=/badger/data
      - BADGER_DIRECTORY_KEY=/badger/key
    volumes:
      - jaeger-badger:/badger
    user: root
  controller:
    image: eosphorosai/dbgpt:latest
    command: dbgpt start controller
    restart: unless-stopped
    environment:
      - TRACER_TO_OPEN_TELEMETRY=True
      - OTEL_EXPORTER_OTLP_TRACES_ENDPOINT=http://jaeger:4317
      - DBGPT_LOG_LEVEL=DEBUG
    networks:
      - dbgptnet
  llm-worker:
    image: eosphorosai/dbgpt:latest
    command: dbgpt start worker --model_type proxy --model_name chatgpt_proxyllm --model_path chatgpt_proxyllm --proxy_server_url ${OPENAI_API_BASE}/chat/completions --proxy_api_key ${OPENAI_API_KEY} --controller_addr http://controller:8000
    environment:
      # Your real openai model name, e.g. gpt-3.5-turbo, gpt-4o
      - PROXYLLM_BACKEND=gpt-3.5-turbo
      - TRACER_TO_OPEN_TELEMETRY=True
      - OTEL_EXPORTER_OTLP_TRACES_ENDPOINT=http://jaeger:4317
      - DBGPT_LOG_LEVEL=DEBUG
    depends_on:
      - controller
    restart: unless-stopped
    networks:
      - dbgptnet
    ipc: host
  embedding-worker:
    image: eosphorosai/dbgpt:latest
    command: dbgpt start worker --worker_type text2vec --model_name proxy_http_openapi --model_path proxy_http_openapi --proxy_server_url ${OPENAI_API_BASE}/embeddings --proxy_api_key ${OPENAI_API_KEY} --controller_addr http://controller:8000
    environment:
      - proxy_http_openapi_proxy_backend=text-embedding-3-small
      - TRACER_TO_OPEN_TELEMETRY=True
      - OTEL_EXPORTER_OTLP_TRACES_ENDPOINT=http://jaeger:4317
      - DBGPT_LOG_LEVEL=DEBUG
    depends_on:
      - controller
    restart: unless-stopped
    networks:
      - dbgptnet
    ipc: host
  webserver:
    image: eosphorosai/dbgpt:latest
    command: dbgpt start webserver --light --remote_embedding --controller_addr http://controller:8000
    environment:
      - LLM_MODEL=chatgpt_proxyllm
      - EMBEDDING_MODEL=proxy_http_openapi
      - TRACER_TO_OPEN_TELEMETRY=True
      - OTEL_EXPORTER_OTLP_TRACES_ENDPOINT=http://jaeger:4317
    depends_on:
      - controller
      - llm-worker
      - embedding-worker
    volumes:
      - dbgpt-data:/app/pilot/data
      - dbgpt-message:/app/pilot/message
    ports:
      - 5670:5670/tcp
    restart: unless-stopped
    networks:
      - dbgptnet
volumes:
  dbgpt-data:
  dbgpt-message:
  jaeger-badger:
networks:
  dbgptnet:
    driver: bridge
    name: dbgptnet
You can start the cluster with the following command:
OPENAI_API_KEY="{your api key}" OPENAI_API_BASE="https://api.openai.com/v1" docker compose up -d
Please replace {your api key} with your real OpenAI API key and https://api.openai.com/v1
with your real OpenAI API base URL.
You can see more details about the docker-compose file in the docker/compose_examples/observability/docker-compose.yml documentation.
After the cluster is started, you can access the Jaeger UI at http://localhost:16686 to view the traces.
Show RAG Conversation Trace
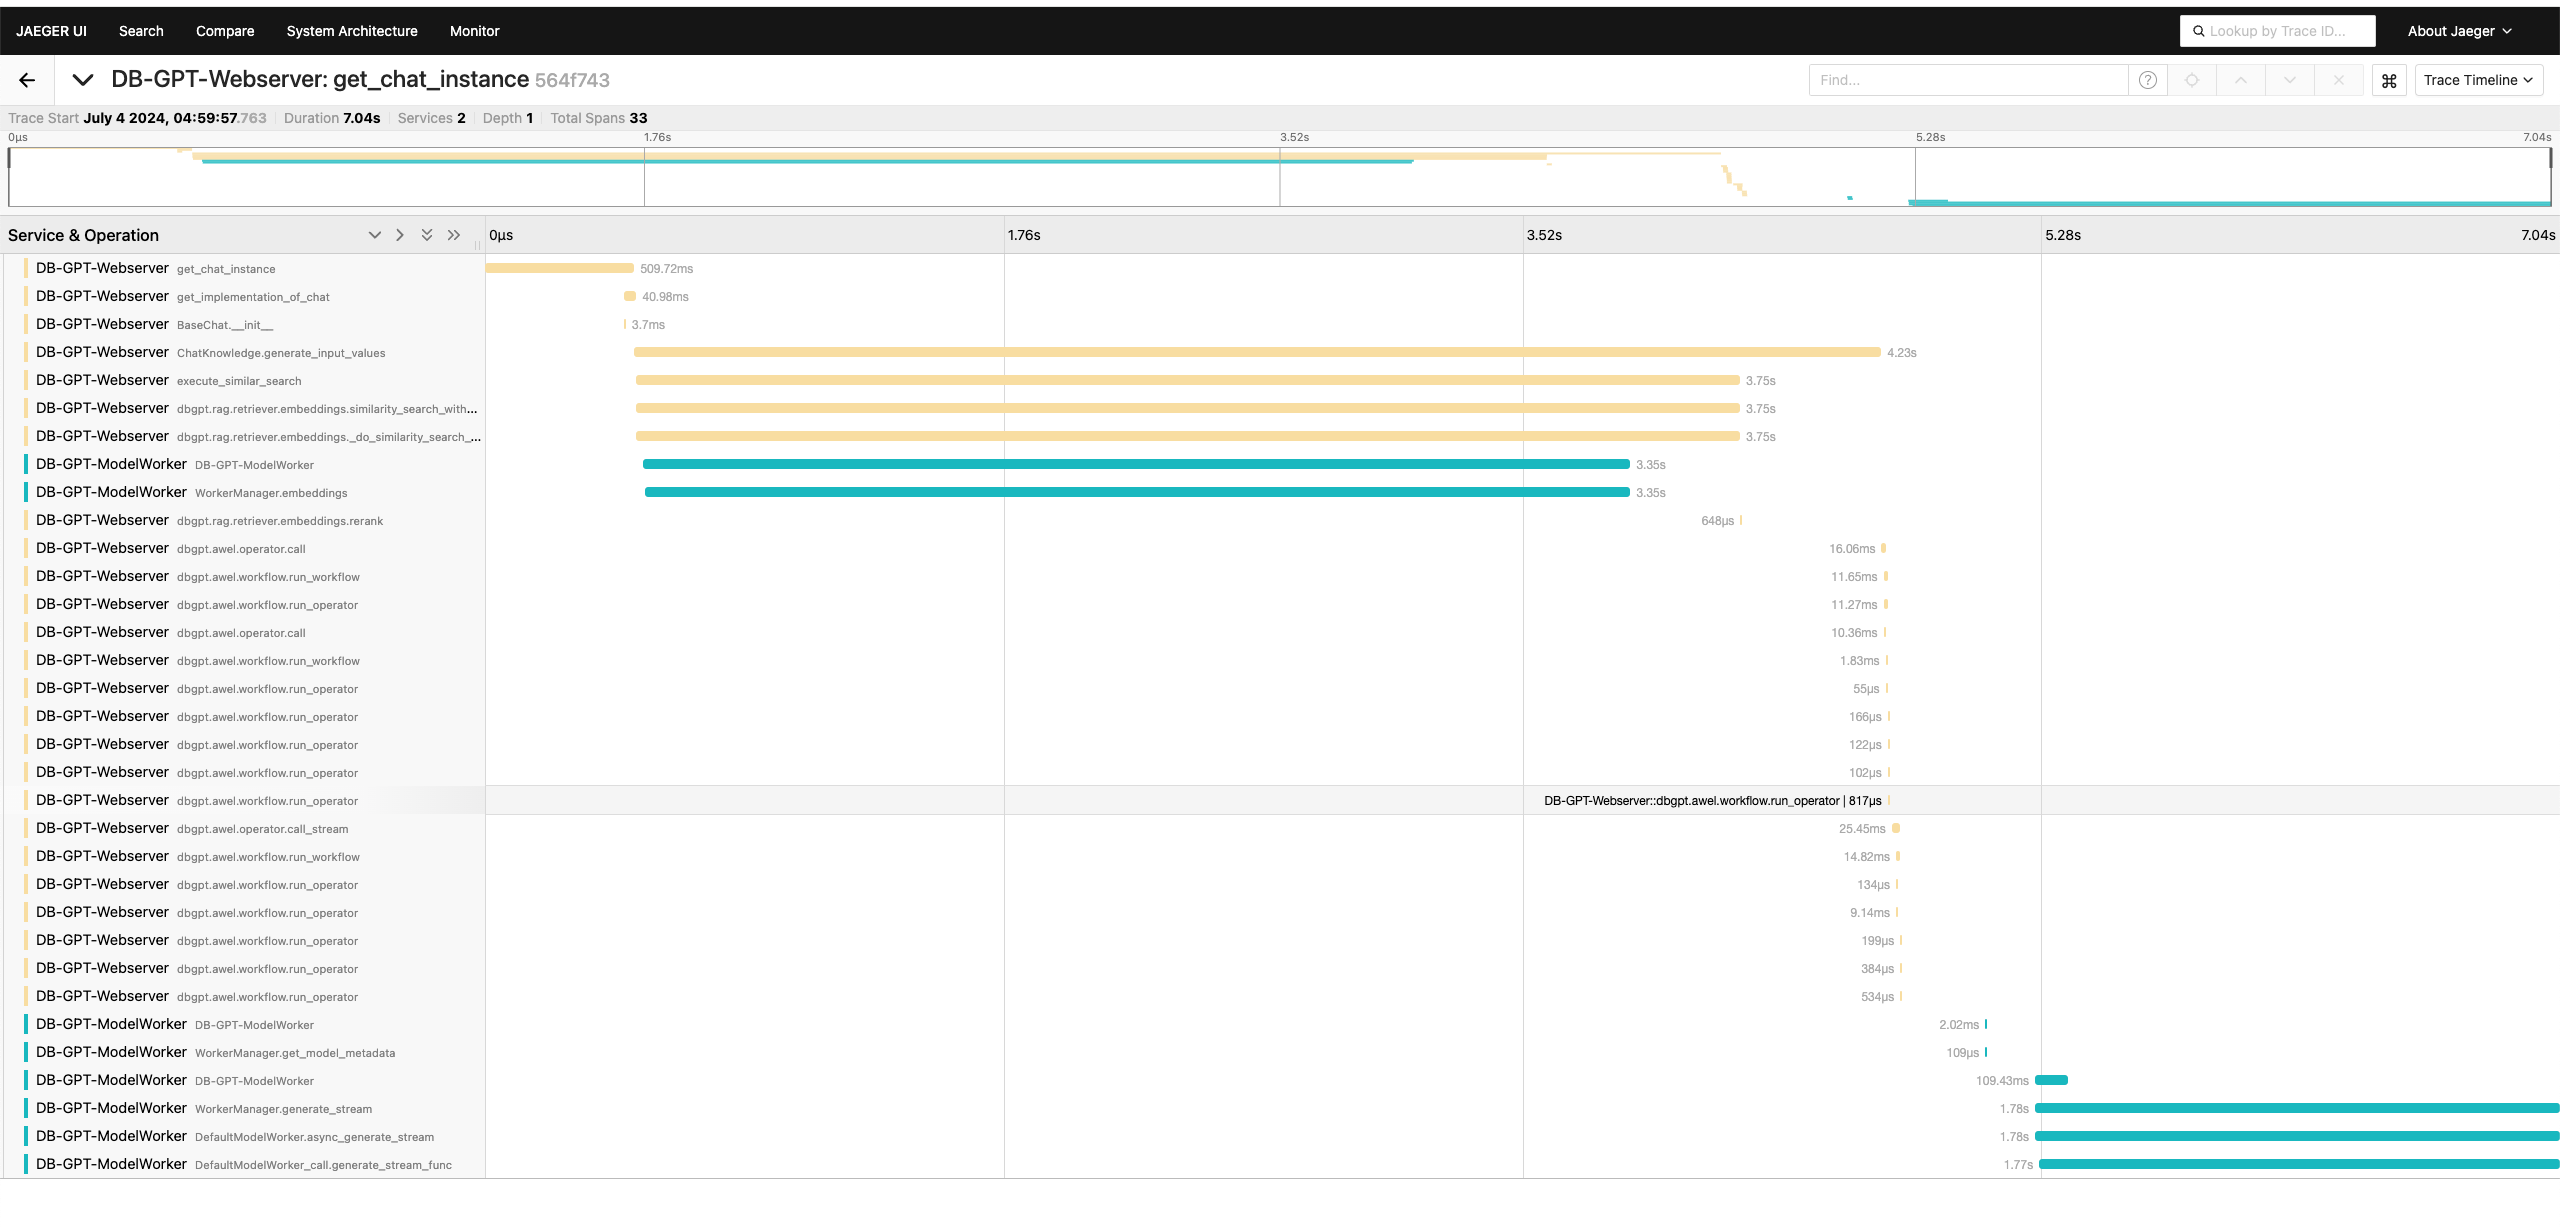
In the above screenshot, you can see the trace of cross-service communication between the DB-GPT controller, LLM worker, and webserver.