Apple Historical Financial Dashboard
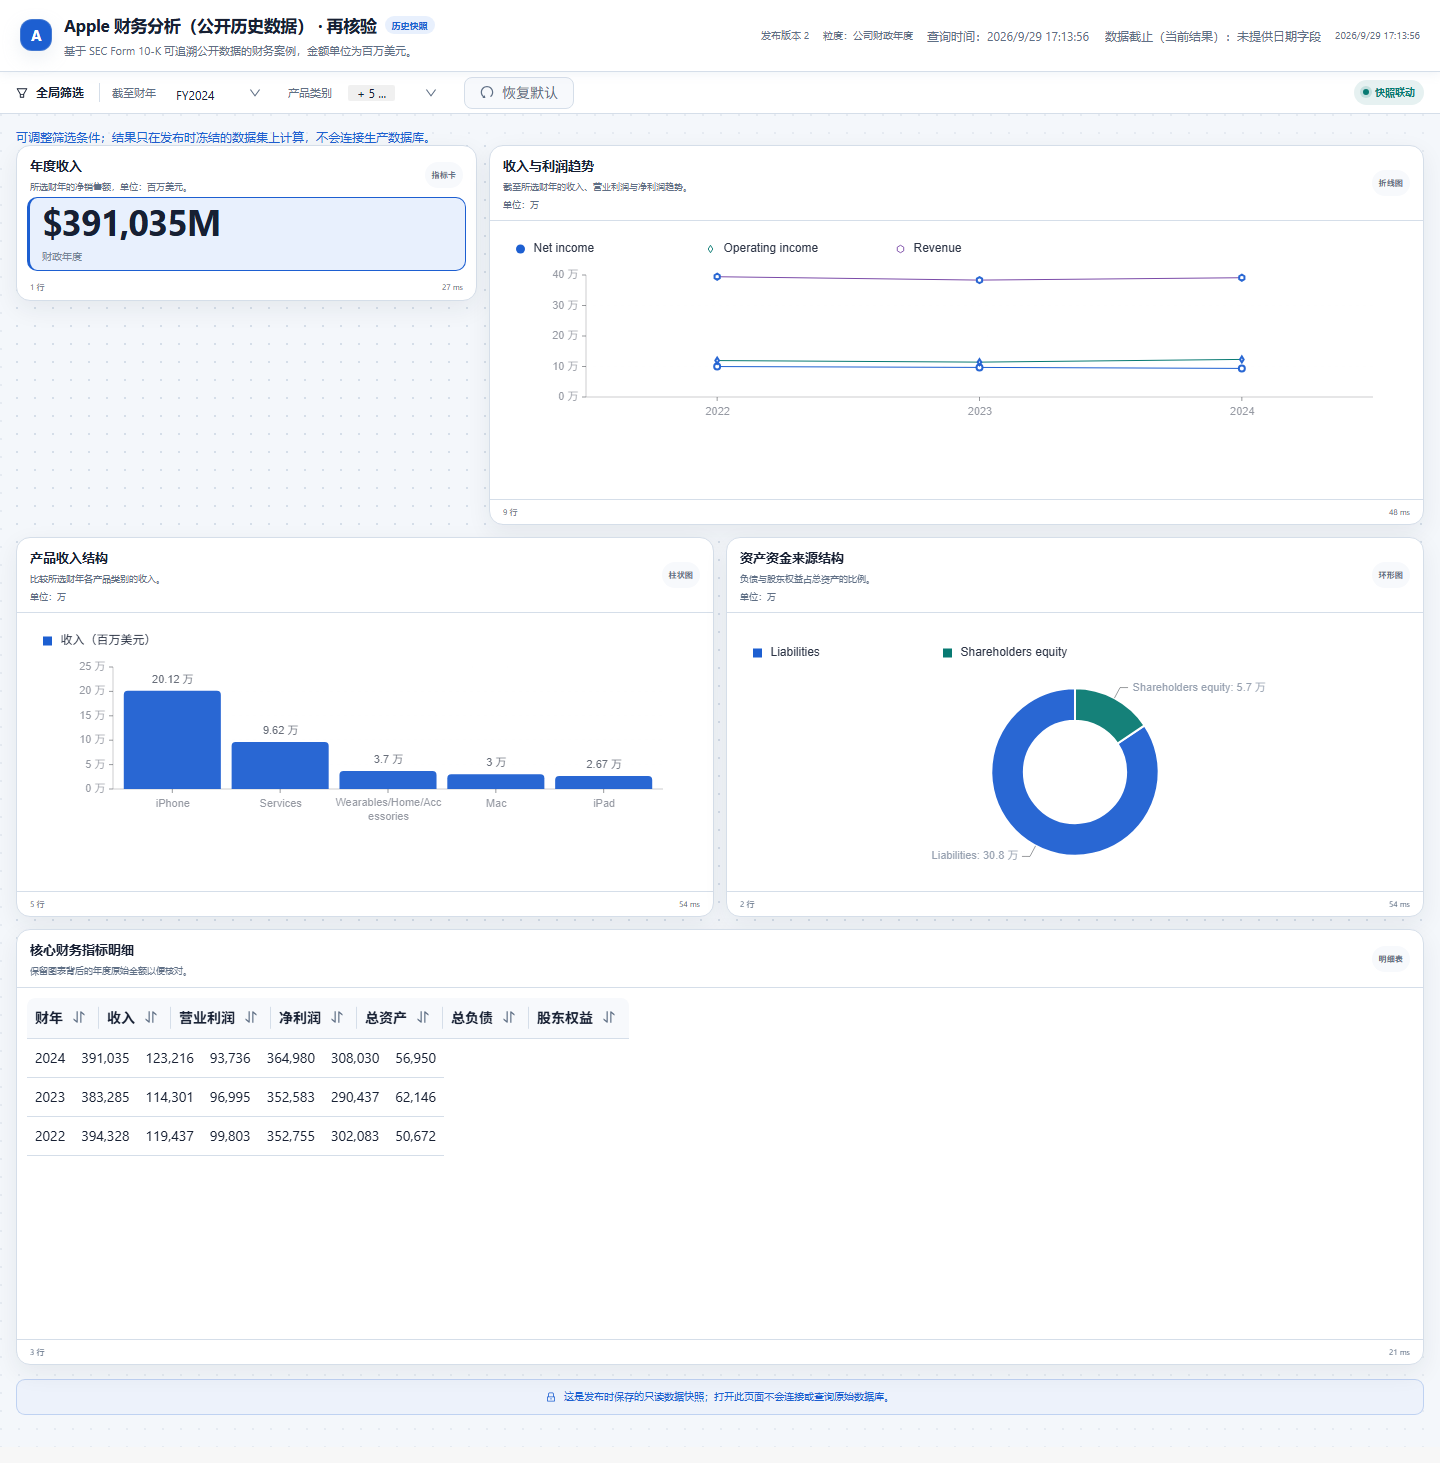
This example uses a compact extract of Apple's public FY2022–FY2024 financial reports to show annual results, trends, product revenue and the composition of assets and financing. Fiscal-year and product filters use the shared Dashboard query, editing and publication capabilities.
See Dashboard Workspace Design for architecture, deployment and upgrades, or the Walmart retail walkthrough for another business example.
Prepare the data
Generate the independent example databases from the repository root:
python examples/dashboard/build_demo_databases.py --output output/dashboard-demo
The generator rebuilds example databases with the same names in the target directory. Register output/dashboard-demo/apple_financial_demo.db on the data-source page. See apple-financial.schema.json for the fixed definition and apple-sec-sources.json for provenance and extraction details. The configured data-source identifier must match the registered source.
| Table | Grain | Rows |
|---|---|---|
annual_financials | Fiscal year: revenue, profit, assets, liabilities and equity | 3 |
product_revenue | Fiscal year × product | 15 |
source_metadata | Fiscal year: source and units | 3 |
Amounts are in USD millions; FY denotes Apple's fiscal year. Sources are Apple's 2024 Form 10-K and 2023 Form 10-K. This is a fixed historical-data example.
| Fiscal year | Revenue | Operating income | Net income |
|---|---|---|---|
| FY2022 | 394,328 | 119,437 | 99,803 |
| FY2023 | 383,285 | 114,301 | 96,995 |
| FY2024 | 391,035 | 123,216 | 93,736 |
Product revenue must sum to total revenue for each year, and assets must equal liabilities plus equity. Check these identities before checking the visualizations.
Create the dashboard and define filter behavior
Plan an FY2022–FY2024 financial dashboard using apple_financial_demo.
Include annual revenue, revenue and profit trends, product revenue,
liabilities and equity, and core financial details.
Provide an as-of fiscal year and a product multiselect.
Use USD millions and retain the SEC source information.
Show the plan first and wait for my confirmation before generating.
| Widget | Filter behavior |
|---|---|
| Annual revenue KPI | Uses the selected fiscal year; product selection does not affect it. |
| Revenue and profit trends | Shows three separate series through the selected fiscal year; do not stack them into a total. |
| Product revenue | Responds to both fiscal-year and product selections. |
| Assets and financing | Uses the selected fiscal year; liabilities plus equity equal assets. |
| Financial details | Shows original values through the selected fiscal year. |
Archived screenshots from the 2026-09-26 development instance show an existing fixed-Schema asset. They are not new model-generation results or browser acceptance for the separated candidate. The KPI suffix M means USD millions; scaled chart axes do not change the original monetary unit.
Edit and publish
- Duplicate the demonstration asset. With the default FY2024 selection, the revenue KPI should be 391,035 and the table should contain three fiscal years.
- Select FY2022. The KPI should become 394,328; the trends and table should retain only data through FY2022.
- Restore FY2024 and select only iPhone. The product chart should narrow its scope while annual revenue remains 391,035.
- Inspect widget SQL and parameter settings, change a title or layout, preview the query, save and reopen.
- Publish a fixed snapshot. In a signed-out window, repeat the fiscal-year and product selections and check their scope and values.
- Check the source information. Project export supports inspection of Schema, SQL and provenance; it is not a standalone offline application.
A fixed Schema supports deterministic regression checks. A model-generated copy requires a separate record of model settings, prompts, manual corrections and observed results. Historical financial charts required manual correction; that record does not establish first-attempt model success.
Validation method
Check live queries and frozen-filter results for all five widgets under four selections: default, FY2022, FY2023 and iPhone only. The historical 2026-09-26 record contains 20/20 matching comparisons and reads of existing pages. It does not establish that the separated candidate repeated every editing and publication step. See the PR validation records for subsequent checks and their scope.
Additional validation on 2026-09-27
The real-model workflow completed generation, editing, saving, returning to the source conversation and anonymous publication. Initial content inspection found four KPIs incorrectly mapped to fiscal years and semantic errors in the series. The asset was manually corrected to the verified five-widget definition in this guide and published again.
Changing FY2024 to FY2022 changed revenue from 391,035 to 394,328. The anonymous API returned 201,183 for iPhone only while total revenue remained 391,035. The 20 independent query/frozen-filter comparisons passed. Amounts are in USD millions. This record includes manual corrections and does not establish first-attempt model success.
Archived screenshots from that date belong to an isolated instance. See the PR validation records for later candidate checks.
Deterministic candidate validation on 2026-09-29
The checked-in five-widget Schema was saved, reopened, refreshed and published as a fixed snapshot through real backend calls, followed by anonymous desktop and mobile visits. Both an independent query and the page showed FY2024 revenue of 391,035 USD millions. No page runtime errors were recorded, and the screenshot was saved after three consecutive captures had matching fingerprints. This validation did not call an external model and does not replace the filter matrix or model-semantic evaluation above.