Walmart Retail Dashboard
This walkthrough reviews retail performance through overall sales, changes over time and store contributions. It uses a total-sales KPI, a monthly trend and a store ranking. Query inspection, layout editing, saving and publishing use the shared Dashboard workspace.
See Dashboard Workspace Design for architecture, deployment and upgrades, or the Apple financial walkthrough for another business example.
Data sources and reproducibility
Choose between the two retail inputs before starting:
| Input | Availability and purpose | Numerical scope |
|---|---|---|
| Synthetic retail example | Run the repository generator to create walmart_sales_demo.db. | A functional demonstration for an independent installation; its values differ from the historical case below. |
| Historical Walmart validation source | CSV and SQLite examples already included in the upstream baseline, using table walmart_sales. | Compared byte-for-byte and row-for-row with a public Kaggle copy as described below; it is not newly fabricated data. |
Generate independent demonstration data from the repository root:
python examples/dashboard/build_demo_databases.py --output output/dashboard-demo
The command rebuilds example databases with the same names in the target directory. Use a dedicated directory rather than a business database location. Register the generated SQLite file on the DB-GPT data-source page, then build the dashboard against its actual tables. See the fixed schemas. The generator defines a separate example schema; the SQL for the historical source below cannot be applied to it directly.
The historical case is reproducible from Walmart_Sales.csv and Walmart_Sales.db, already included in the upstream baseline. Register the database as Walmart_Sales. The matching public copy is Kaggle Walmart Sales. The CSV downloaded on 2026-09-27 and the repository CSV both have SHA-256 9cd52db918f0249288b8bdb35dcdaeede5ed7a55f8ed1f8b910a93a550cbf893. This establishes identical content, not the original developer's download source or additional redistribution permission. The historical case uses the existing upstream files.
Run the following offline check to compare all 6,435 rows and eight fields per row between the CSV and database, and verify the business key, dates and sales total. The database is opened read-only:
python examples/dashboard/verify_walmart_source.py
The historical source uses these definitions:
| Item | Definition or historical check |
|---|---|
| Grain | One sales week for one store; business key: Store + Date. |
| Rows and stores | 6,435 rows and 45 stores. |
| Time coverage | 2010-02-05 through 2012-10-26; 143 weekly dates and 33 year-months. |
| Key fields | Store, Date, Weekly_Sales and Holiday_Flag; Date is text in DD-MM-YYYY format. |
| Total | Weekly_Sales sums to 6,737,218,987.11; no currency conversion. |
| Top five stores | 20, 4, 14, 13 and 2, ordered by cumulative sales. |
The historical database file has SHA-256 14c4c65ebfcd34606ea061fd4e7cf5486a22b3fe1736cbd73a8dcd04b958d5a5. Coverage is incomplete for 2010 and 2012, so annual totals are not directly comparable as full-year performance. A cumulative sales ranking also does not measure store efficiency.
Create and check the dashboard
After selecting the historical data source, enter:
Create a compact Walmart retail dashboard with only three widgets:
total sales, a monthly sales trend and a store ranking. Do not add filters.
Show the plan first and wait for my confirmation before generating SQL.
Check the plan's grain and widgets before confirming generation. Verify the KPI total, all 33 year-months, and the amounts and ordering for 45 stores. The monthly query must retain the year:
SELECT substr(Date, 7, 4) || '-' || substr(Date, 4, 2) AS month,
       SUM(Weekly_Sales) AS sales
FROM walmart_sales
GROUP BY substr(Date, 7, 4) || '-' || substr(Date, 4, 2)
ORDER BY month;
Archived screenshots from the 2026-09-26 development instance show existing assets. They do not establish that generation was rerun on the separated submission candidate. Chart axes use scaled labels; check the original query values.
Duplicate the asset and open widget settings to inspect its SQL, output fields and chart mapping. Change a title or layout, preview the query, save, then reopen it to check the result. Dragging and resizing respect layout collision constraints.
Template creation and publication
The retail overview template can create a five-widget copy by mapping date, store, sales and holiday fields. It contains sales, store count, a trend, the top ten stores and holiday totals, with filters. This is a different asset from the three-widget natural-language case without filters.
The archived template view was read from an existing copy on 2026-09-26. Integer KPI formatting does not change query precision. Successful template field mapping is not counted as a new successful model-generation sample.
Choose the fixed-data publication mode and inspect the public page in a signed-out window. The three-widget case has no filters; test each binding separately for the filtered template copy. With the live-update mode, data refreshes according to the published definition. Use an independent test database when changing source values for a demonstration.
Validation method
Record data fingerprints, widget keys, amounts, ordering, the revision after editing and the anonymous publication result. The historical 2026-09-26 record contains 487 aggregate comparisons and reads of existing pages. Those results belong to the integrated version used at the time; they do not establish complete generation, editing and publication acceptance for a later version. See the PR validation records for subsequent checks.
Additional validation on 2026-09-27
A real model generated the three widgets, followed by editing, saving, returning to the conversation and fixed publication. Overlapping layouts were adjusted manually, and the store chart was limited to the top 10 while the original query retained all 45 stores. The anonymous page showed 6,737,218,987.11. On 2026-09-27, 487 aggregate checks and row-by-row CSV/database comparisons passed. The original request did not include filters.
Archived screenshots from that date belong to an isolated instance. See the PR validation records for later candidate checks.
Deterministic candidate validation on 2026-09-29
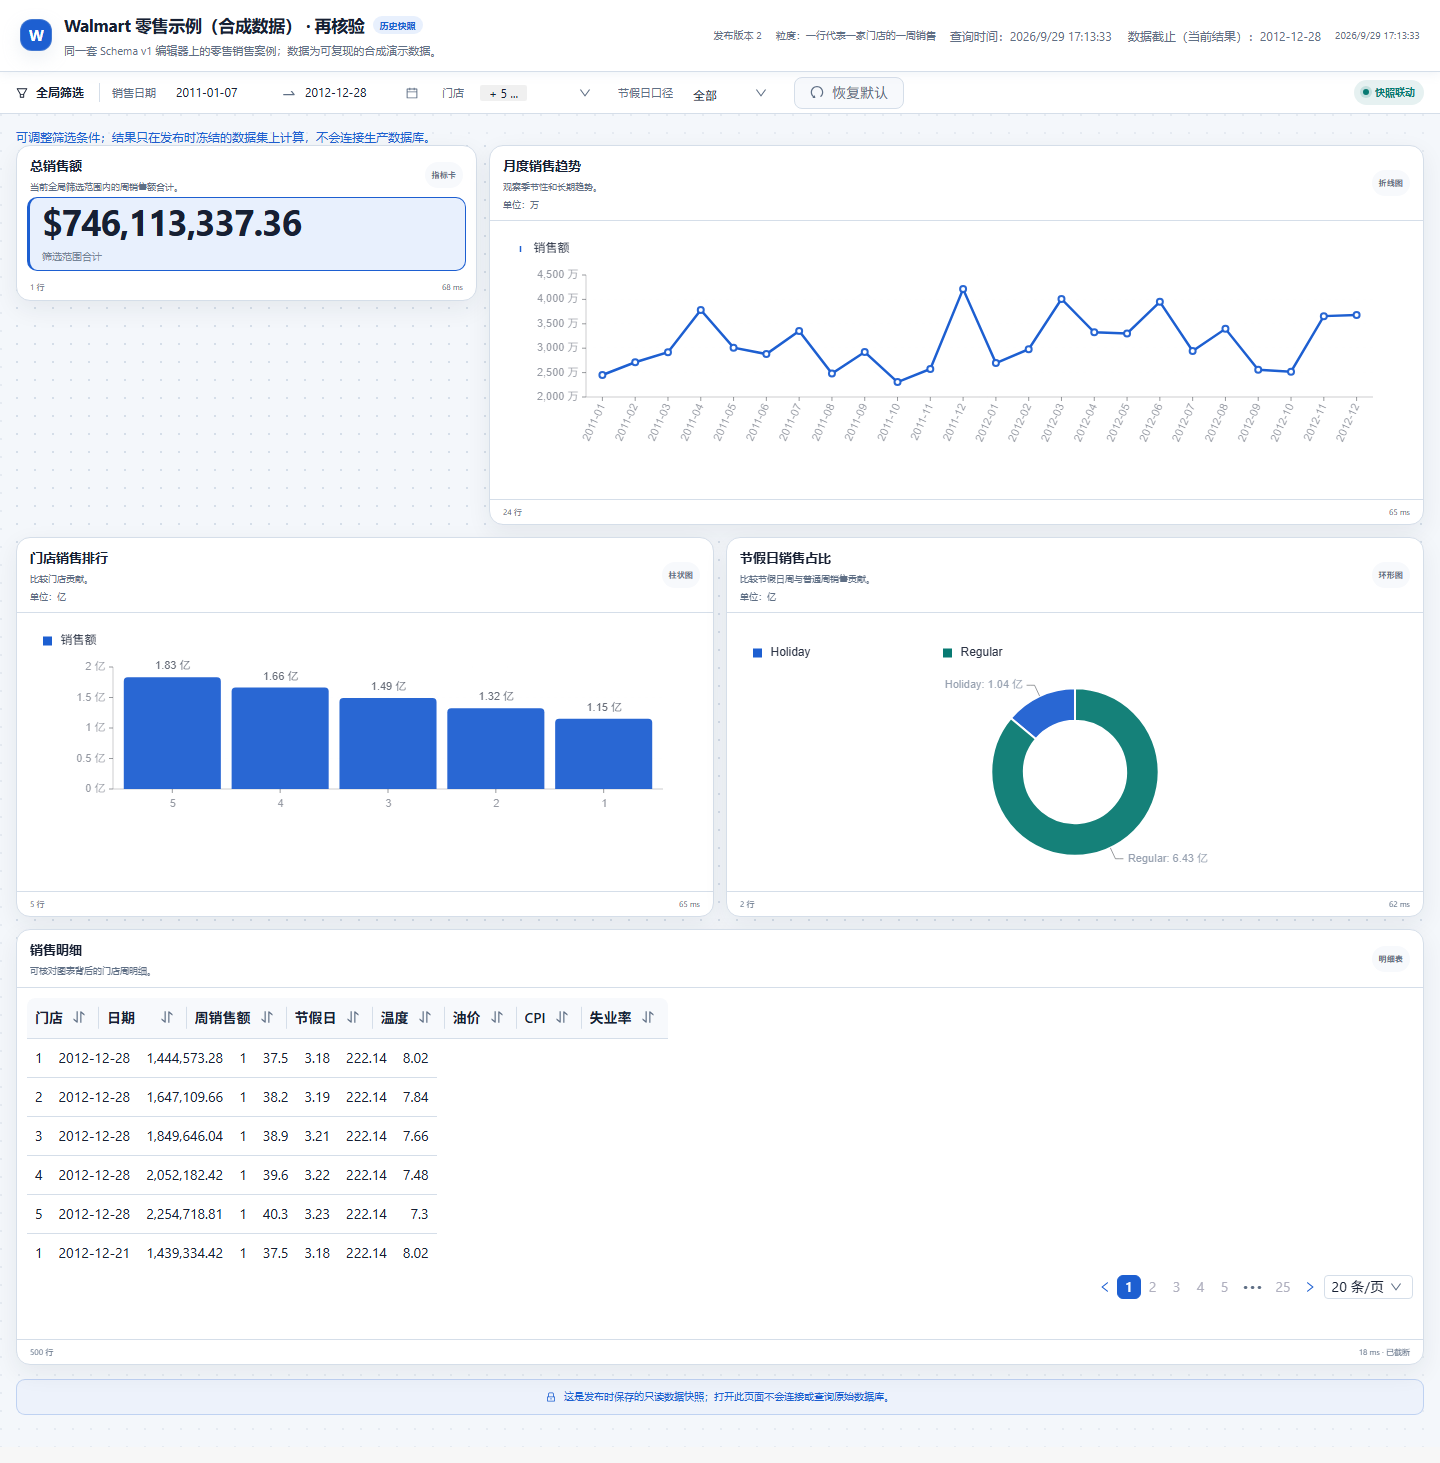
The synthetic retail example used the checked-in five-widget Schema. Real backend calls covered saving, reopening, refreshing and fixed publication, followed by anonymous desktop and mobile visits. An independent query returned total sales of 746,113,337.36, matching the page. This is a different data source from the historical Walmart case above. No page runtime errors were recorded, and the screenshot was saved after three consecutive captures had matching fingerprints. This validation did not call an external model.