Traceable Analysis Report Technical Design
This document describes the design of the data analysis report capability: how real execution results are persisted as artifacts, how values and charts in a report are bound to their sources, and how a failed report can reuse existing results instead of rerunning the analysis. The design is based on the protocols, execution tools, report service, and frontend implementation of the current DB-GPT branch.
1. Overall Architecture and Responsibilities
The system is organized around one principle: capture execution artifacts first, then generate the report from references. The task agent plans the analysis and invokes tools; the capture layer persists real execution results; the dedicated report agent selects evidence and composes content; the template engine resolves values and validates bindings; the report service stores documents and indexes, which the frontend uses for display and source lookup. Modules exchange artifact identifiers and selectors, as shown in Figure 1.
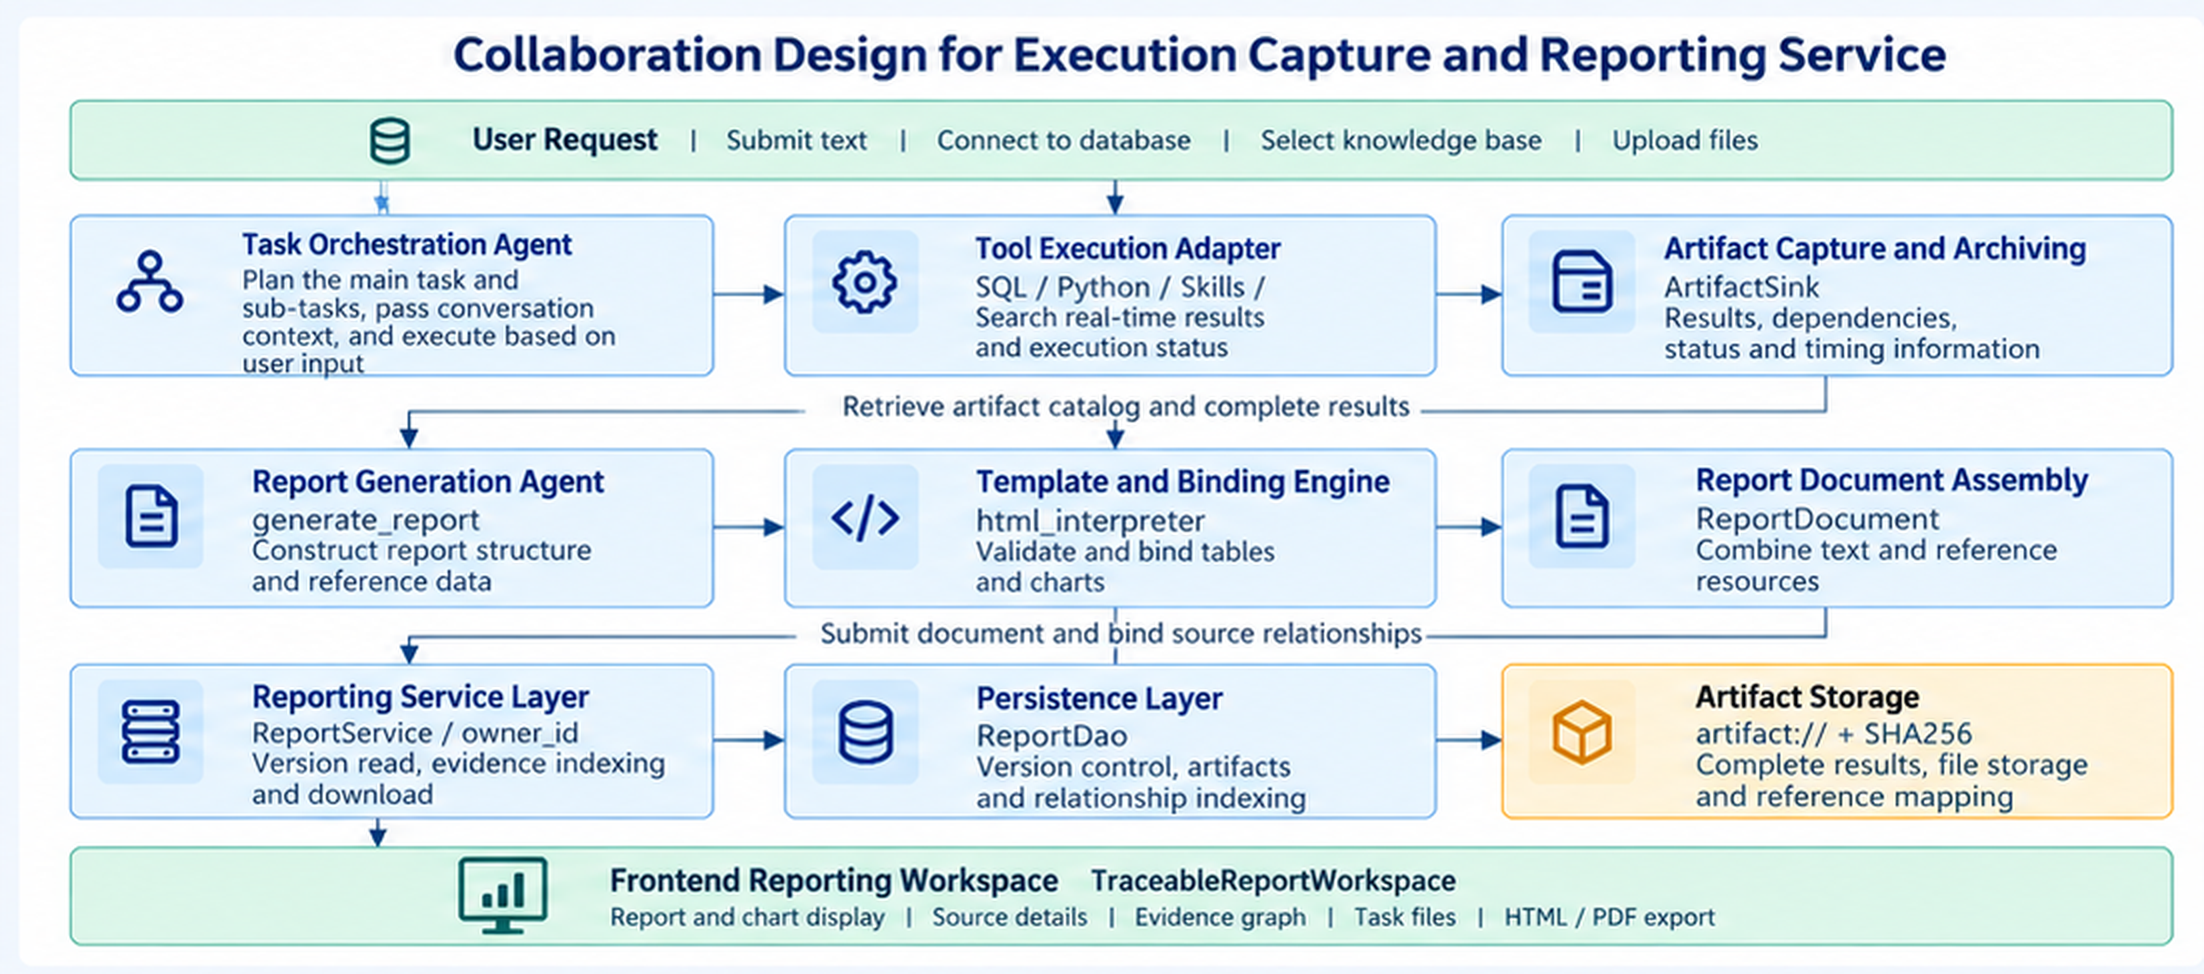
Figure 1. Collaboration design for execution capture and the report service
The main task and its parallel subtasks write results to the same conversation-level ArtifactSink. The shared report_capture layer records execution evidence; the application-layer report agent and html_interpreter compose and bind report content; dbgpt_serve.report handles persistence and queries. Large results and files are stored in content storage, while metadata and relationships are stored in the report database.
2. Data Model for Artifacts and Evidence
The model records two distinct kinds of relationships. Production dependencies answer which inputs produced a given result; body citations answer which result is used at a given place in the report. The former links artifacts through input_artifact_ids; the latter links a report target to a source location through EvidenceReference. A report revision freezes both relationships together with their content snapshots, as shown in Figure 2.
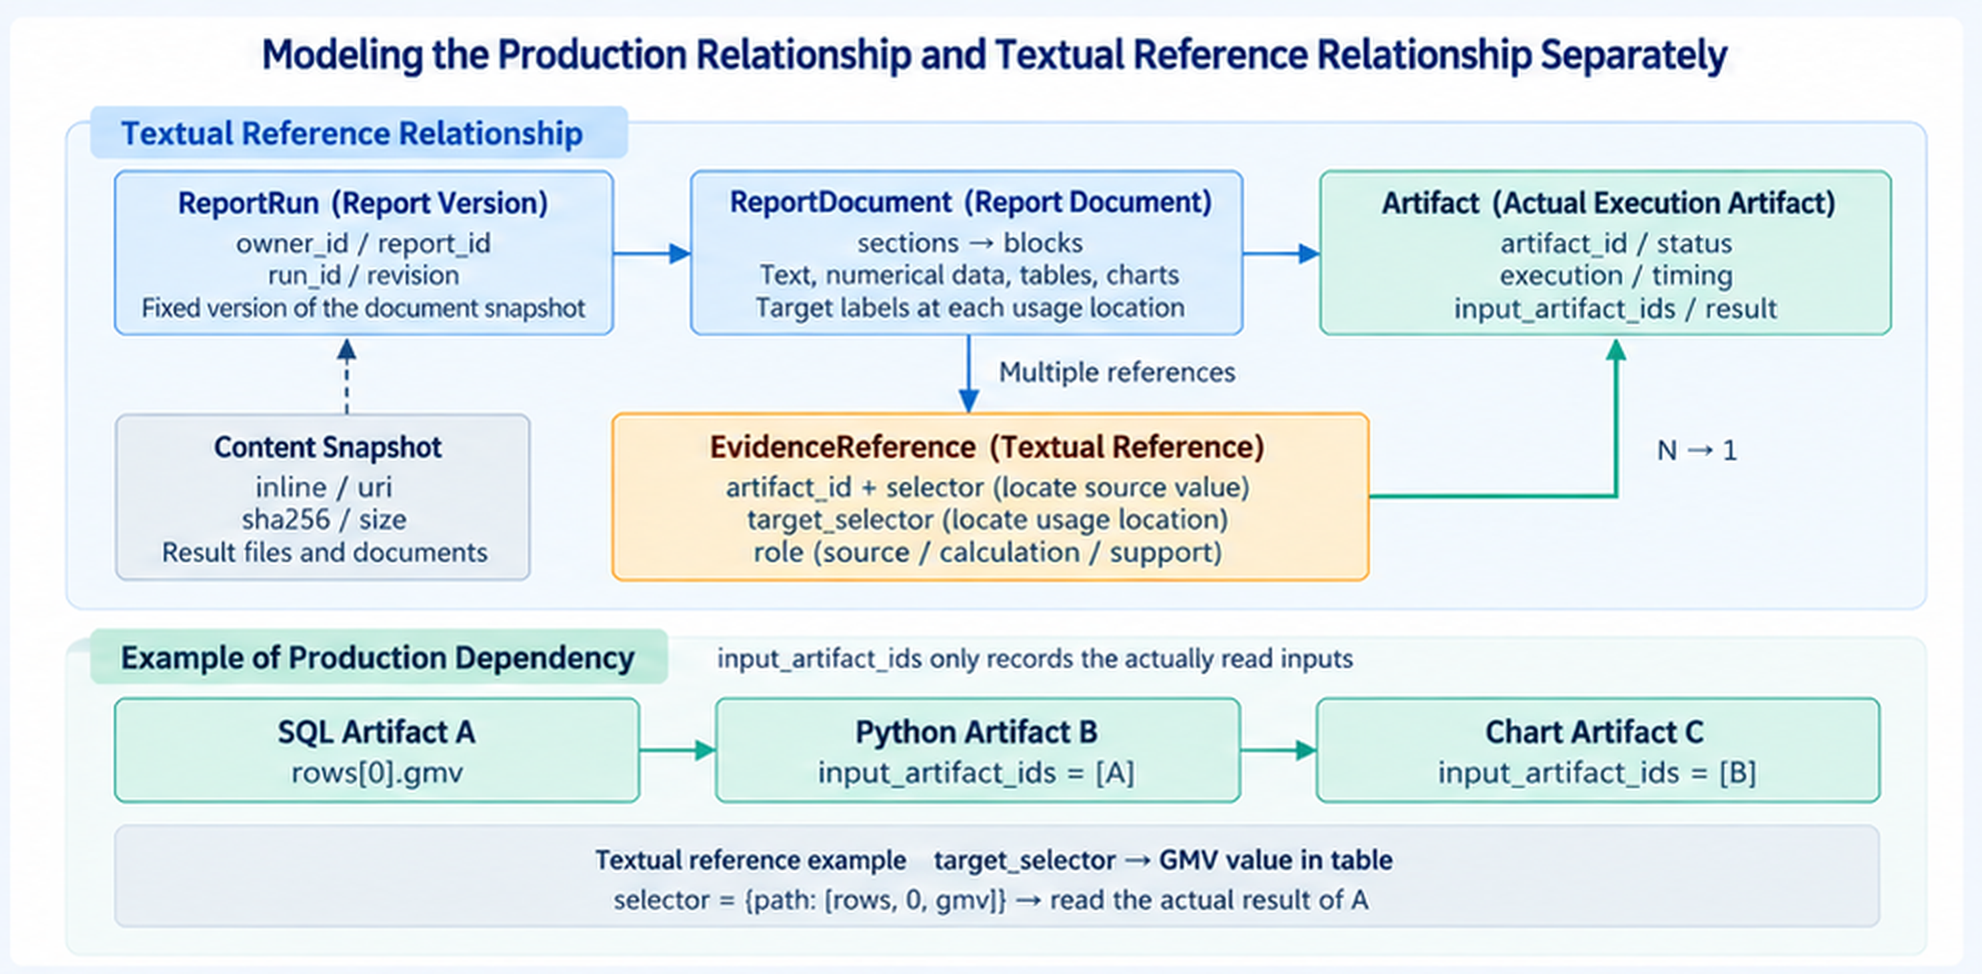
Figure 2. Independent modeling of production dependencies and body citations
| Data object | Key fields | Relationship meaning |
|---|---|---|
| Artifact | artifact_id, execution, status, input_artifact_ids | One real execution and its input dependencies |
| ArtifactContent | inline, uri, sha256, size | Content snapshot of an execution result, citation, or file |
| ReportDocument | sections, blocks, artifacts | Persistable report structure and artifact set |
| EvidenceReference | artifact_id, selector, target_selector, role | Source value location and its location of use in the body |
| ReportRun | owner_id, report_id, run_id, revision | Immutable report revision isolated per user |
| RenderObservation | artifact_id, renderer, status, timing | Independent observation of what the browser actually rendered |
For example, a GMV value reference can be declared as artifact_id = sql_A, path = ["rows", 0, "gmv"]. The engine reads the actual result, formats the display value, and assigns a target identifier to that fragment. A single SQL artifact can support multiple places in the body; when Python computation or a chart consumes it, that input dependency is recorded separately.
3. Execution Capture and Report Recovery
Report construction starts from completed artifacts and proceeds through spec construction, reference resolution, binding validation, rendering, and persistence. Errors return to the relevant stage through checkpoints instead of restarting the entire analysis; a completed report and an unfinished task return distinct statuses. The flow is shown in Figure 3.
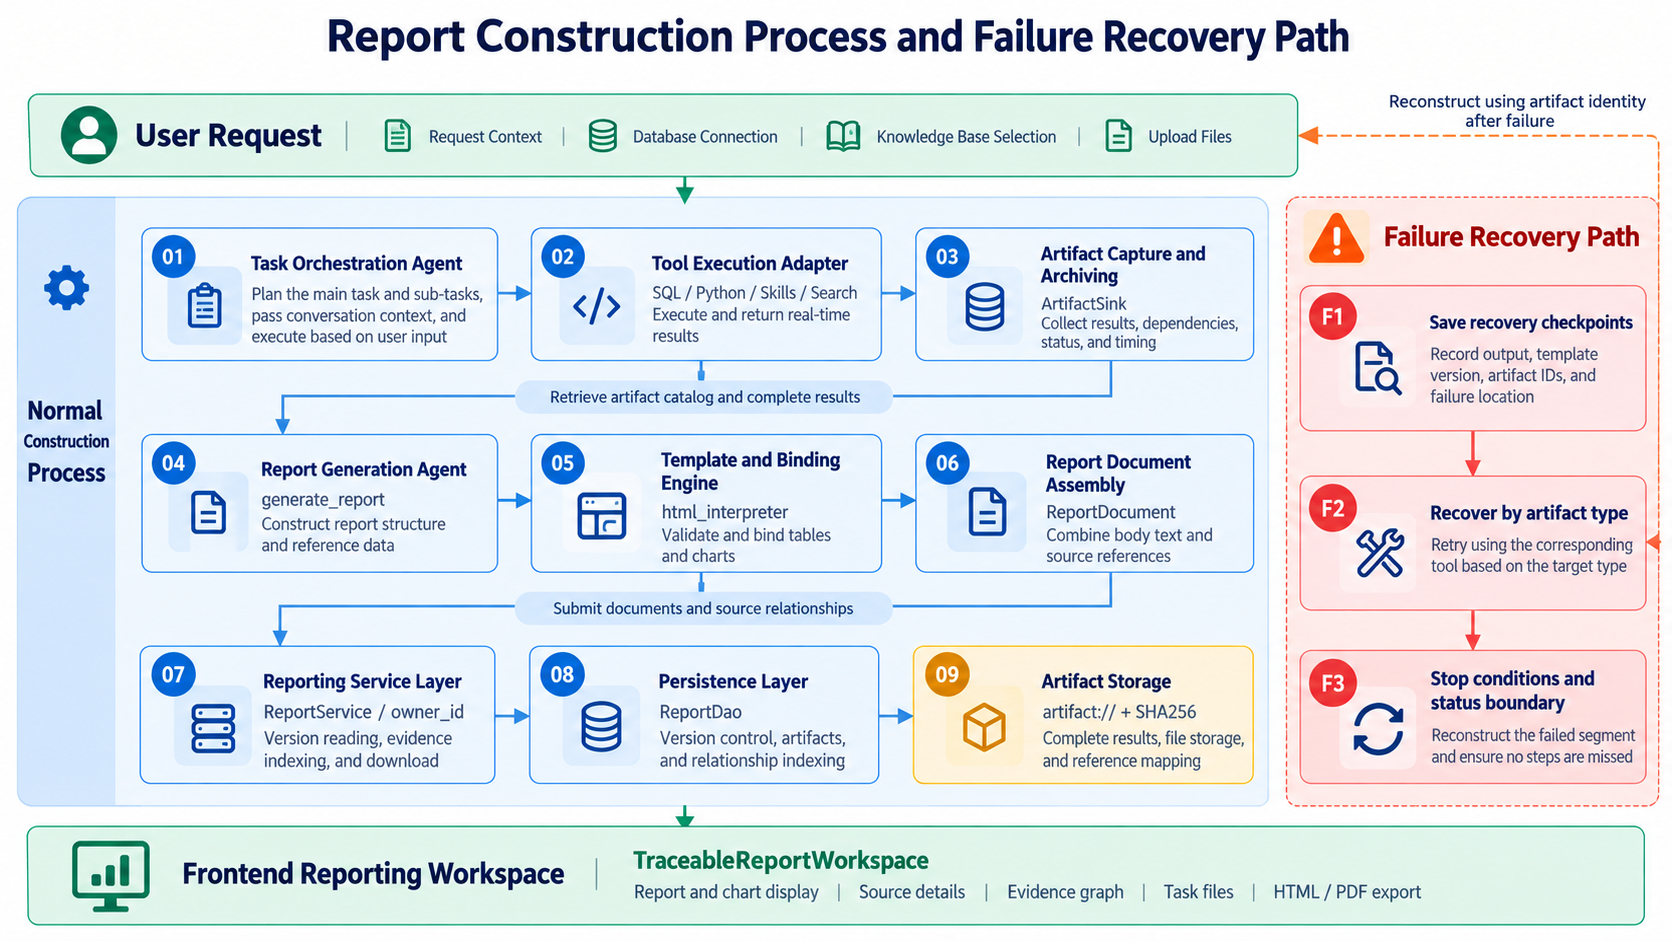
Figure 3. Report generation validation and failure recovery flow
Capture happens at the tool-execution boundary: SQL captures the query, columns, and result rows; Python captures the code, exit status, and REPORT_RESULT; skills capture the script and arguments; knowledge reads capture the source text and location. A result is snapshotted before any UI preview is produced. Python reads SQL results through SQL_RESULTS and tracks the actual inputs; local subprocesses use the backend module path so they do not read the wrong directory when multiple worktrees exist.
The report agent declares sections and data references with REPORT_SPEC. The engine validates artifact status, field paths, and display values, expands tables, and creates a separate artifact plus local bindings for each chart. Structured paragraphs render text and references separately so internal objects are never exposed directly as body text.
A failure checkpoint stores the original request, template parameters, artifacts, progress, and error location. On resume, the engine first re-renders with the original parameters, then repairs references, appends sections, or computes only the missing metrics. The recovery layer builds an error fingerprint from the error code and target location and tracks invocation, specification, and rendering failures separately. Repeated failures or an exhausted total budget stop the run and preserve the remaining work. Text values that may degrade are shown as -- with a diagnostic record and are not published as verified values.
4. Version Persistence and Source Lookup
After rendering, the assembler combines sections, body fragments, artifacts, and bindings into a ReportDocument. ReportDao appends the ReportRun, artifact snapshots, artifact dependencies, and evidence index in one transaction and updates the report's latest-revision pointer. Saved revisions are never rewritten in place; re-analysis or repair creates a new revision, so a user looking up a past revision sees the evidence that revision actually used.
The storage layer uses dbgpt_report, dbgpt_report_run, dbgpt_report_artifact, dbgpt_report_artifact_dependency, and dbgpt_report_evidence for report entry points, revisions, artifacts, dependencies, and body evidence, respectively. Large results and files use artifact:// content addresses and SHA256 snapshots. Reads verify content integrity, and truncation in a UI preview never changes the underlying referenced value.
The frontend pins a revision through /api/v1/reports/{report_id}/runs/{run_id}; clicking a body target requests /blocks/{block_id}/evidence, and downloading a snapshot requests /artifacts/{artifact_id}/content. The service checks visibility by owner_id, then uses the evidence index to locate the artifact and selector and returns the code, result, or source text. Source lookup preserves both the location of use in the report and the actual location of the value.
5. Graph Rendering and Report Delivery
The evidence graph is a view projection of the saved relationships. Sources are organized by database, knowledge file, and uploaded file; execution groups status and results by conversation, task, run, and step identifier; outputs show only the actual report or task files. Knowledge chunks are aggregated under file nodes while their source text and locations remain available in detail; production edges come from explicit input dependencies, never from filename or timestamp guesses.
The frontend mounts charts from the data and ECharts option in the chart artifact, and stores the actual render result, renderer, duration, and error separately as a RenderObservation. Server-side generation success and browser-side drawing success are observed independently; browser feedback never mutates a saved report revision.
For export, the system waits for fonts and charts to finish rendering, clones the current report, expands collapsed tables, converts readable canvases to images, removes scripts and source-review controls, and then produces an HTML reading copy or hands the document to the browser for PDF printing. The offline copy preserves reading content; interactive charts and source inspection remain available in the online report.
Olist Business Analysis Report Case Study
Step 1: Select Data and Start Analysis
On the home page, the user selects the Olist_Ecommerce database and the Olist_Analytics_Governance knowledge base and asks a business review question covering GMV, order volume, average order value, category and regional performance, and the relationship between delivery and ratings. After submission, the user follows task progress on the left and reads the report's definitions, core metrics, and improvement recommendations on the right, then decides which questions to verify next, as shown in Figure 4.
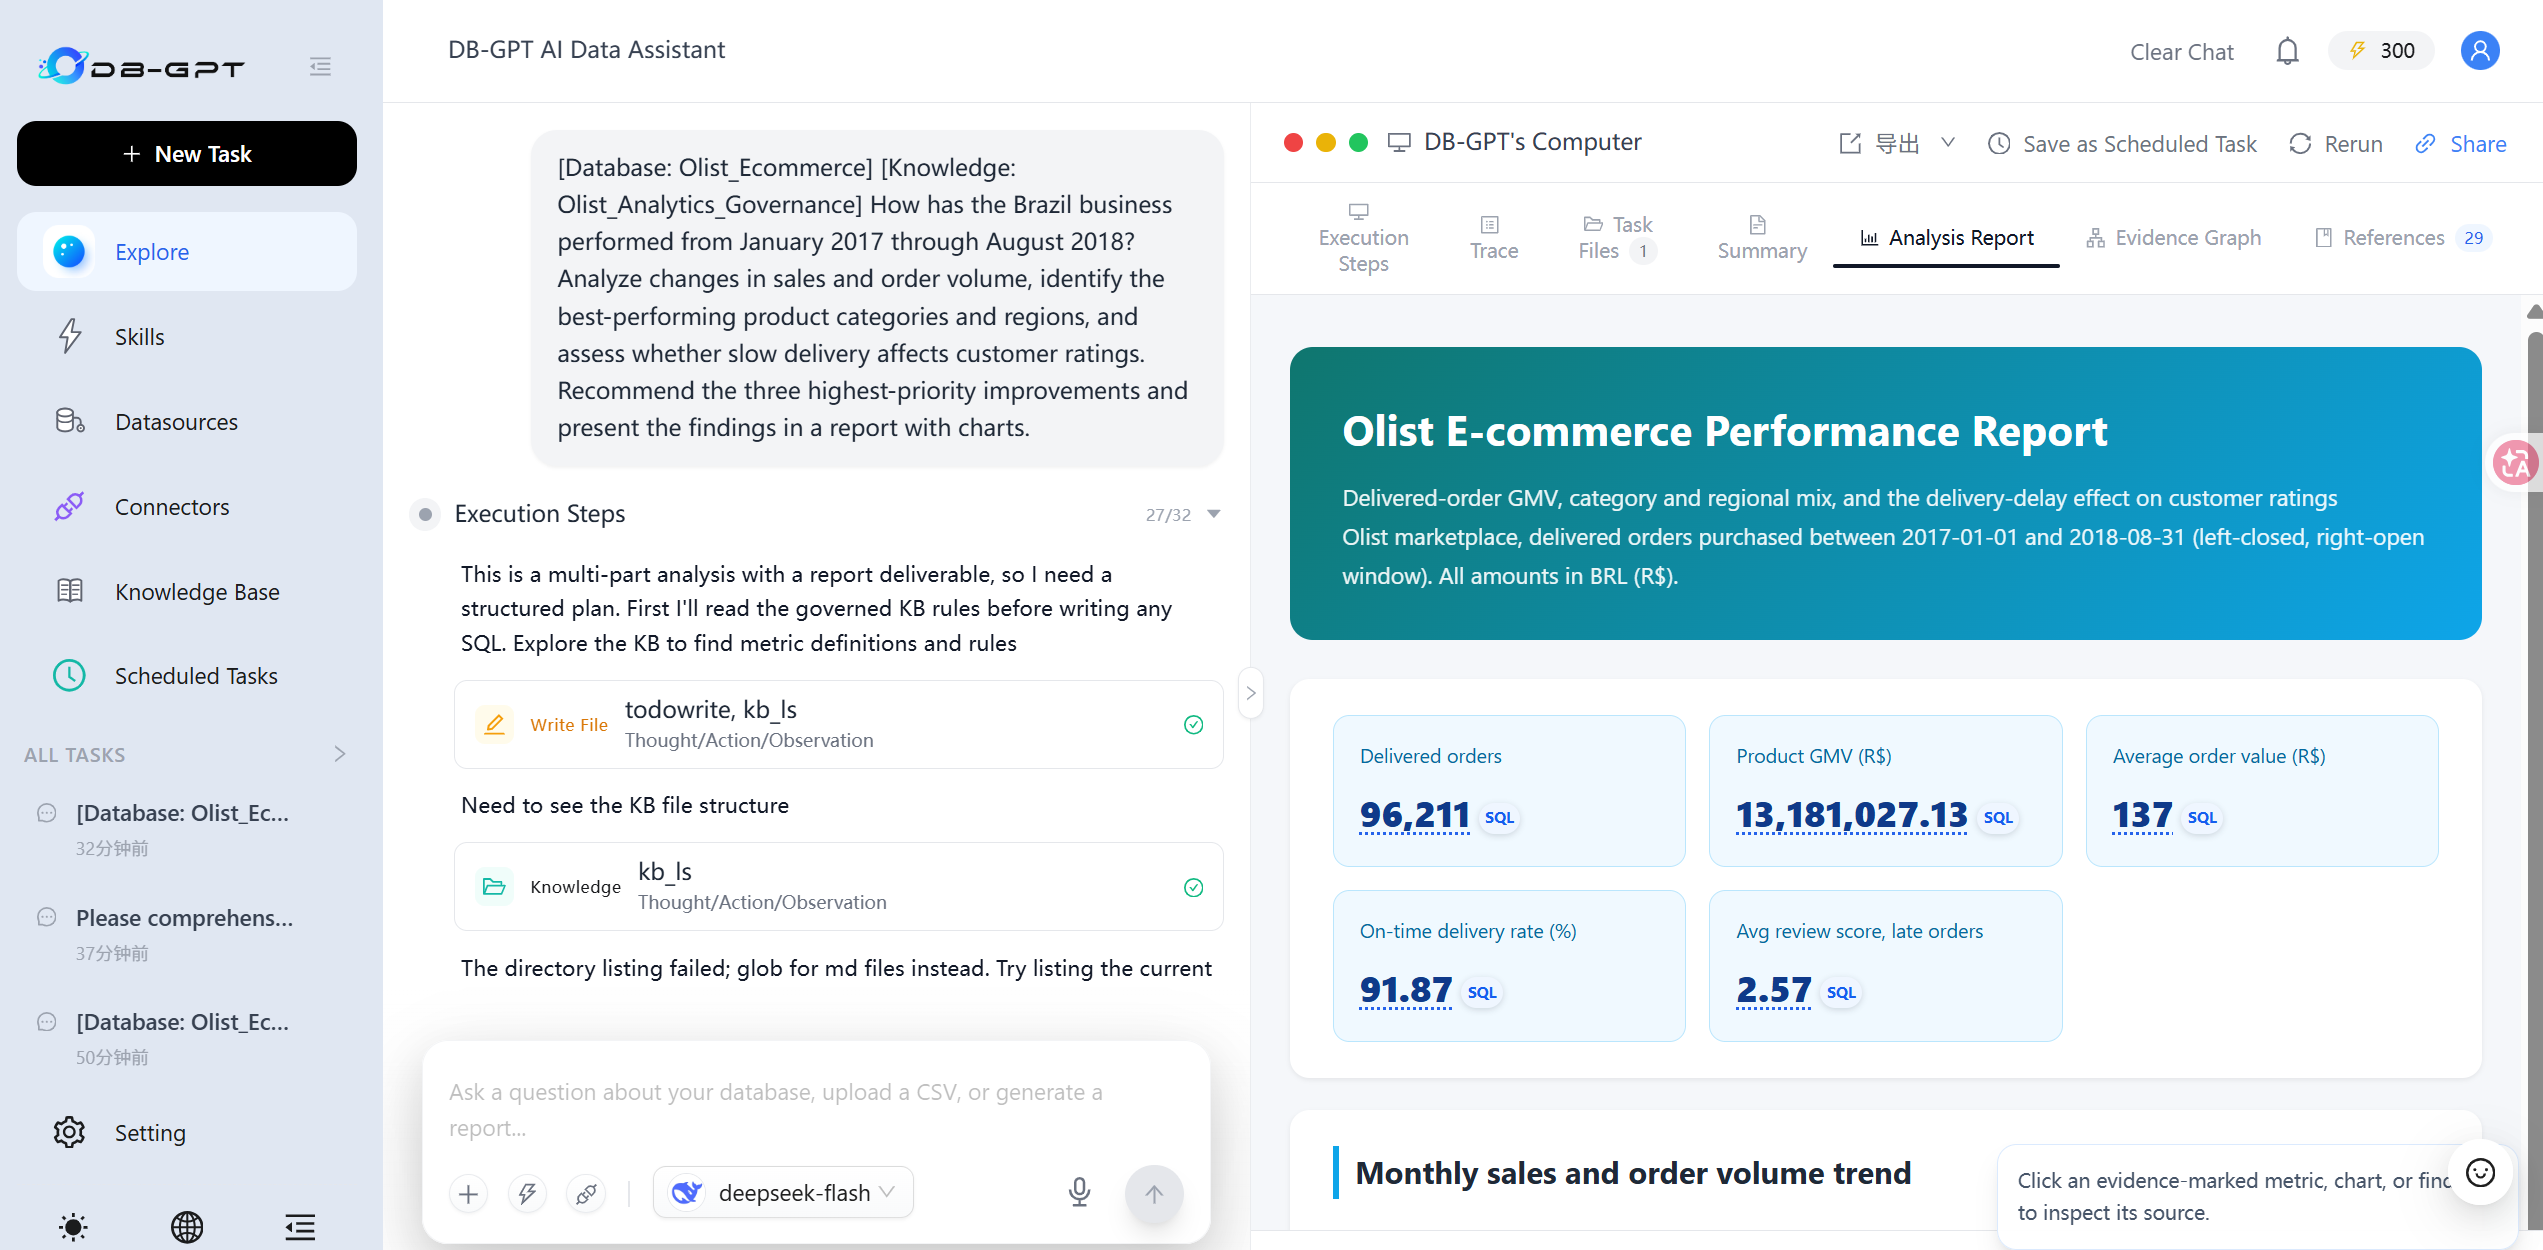
Figure 4. Selecting data, running the analysis, and generating the business report
Step 2: Verify SQL Results for Core Metrics
The user first checks GMV in the report and clicks the SQL badge next to the value to open its source details, including execution status, duration, database, query statement, and result snapshot. By comparing the displayed value with the query result, the user can confirm which field the metric used and inspect the query conditions when the definition is in doubt, without searching the full conversation for the execution record. See Figure 5.
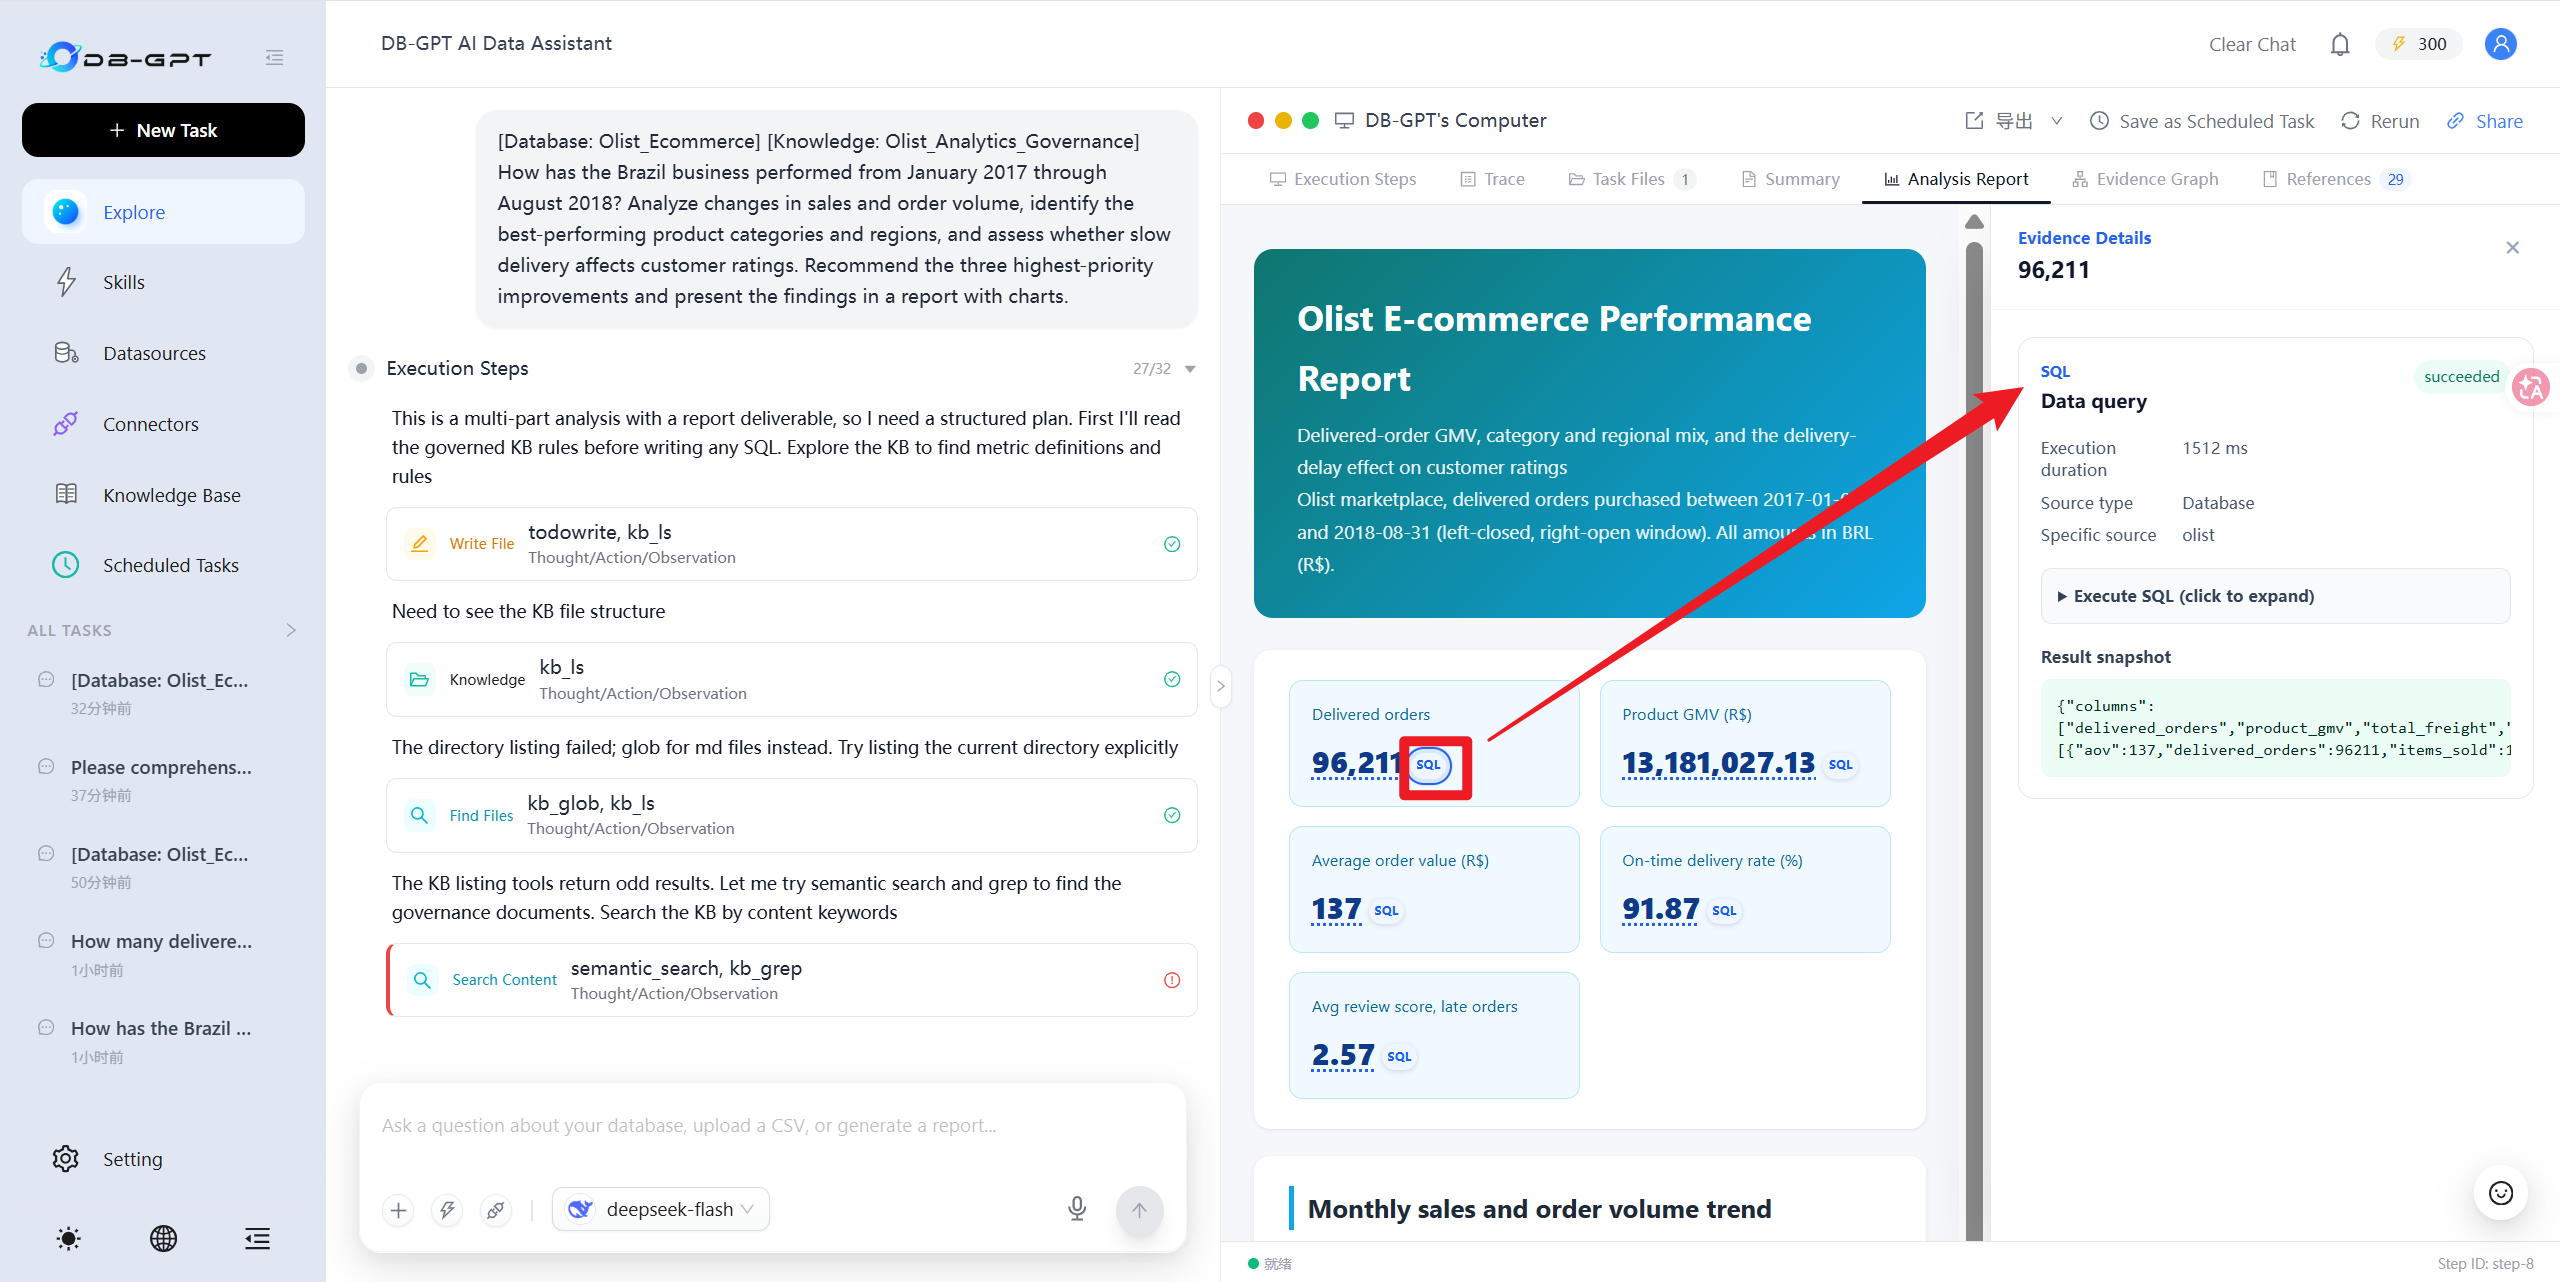
Figure 5. Opening execution evidence through the GMV SQL badge
Step 3: Confirm the Knowledge Basis for Metric Definitions
The user then clicks the KB badge next to the methodology note to inspect the knowledge file, source excerpt, and read location used by this analysis, confirming the order filter, deduplication, currency unit, and delivery grouping rules. When a metric name is ambiguous, the user can compare this rule with the query conditions to judge whether the report answers the original business question. See Figure 6.
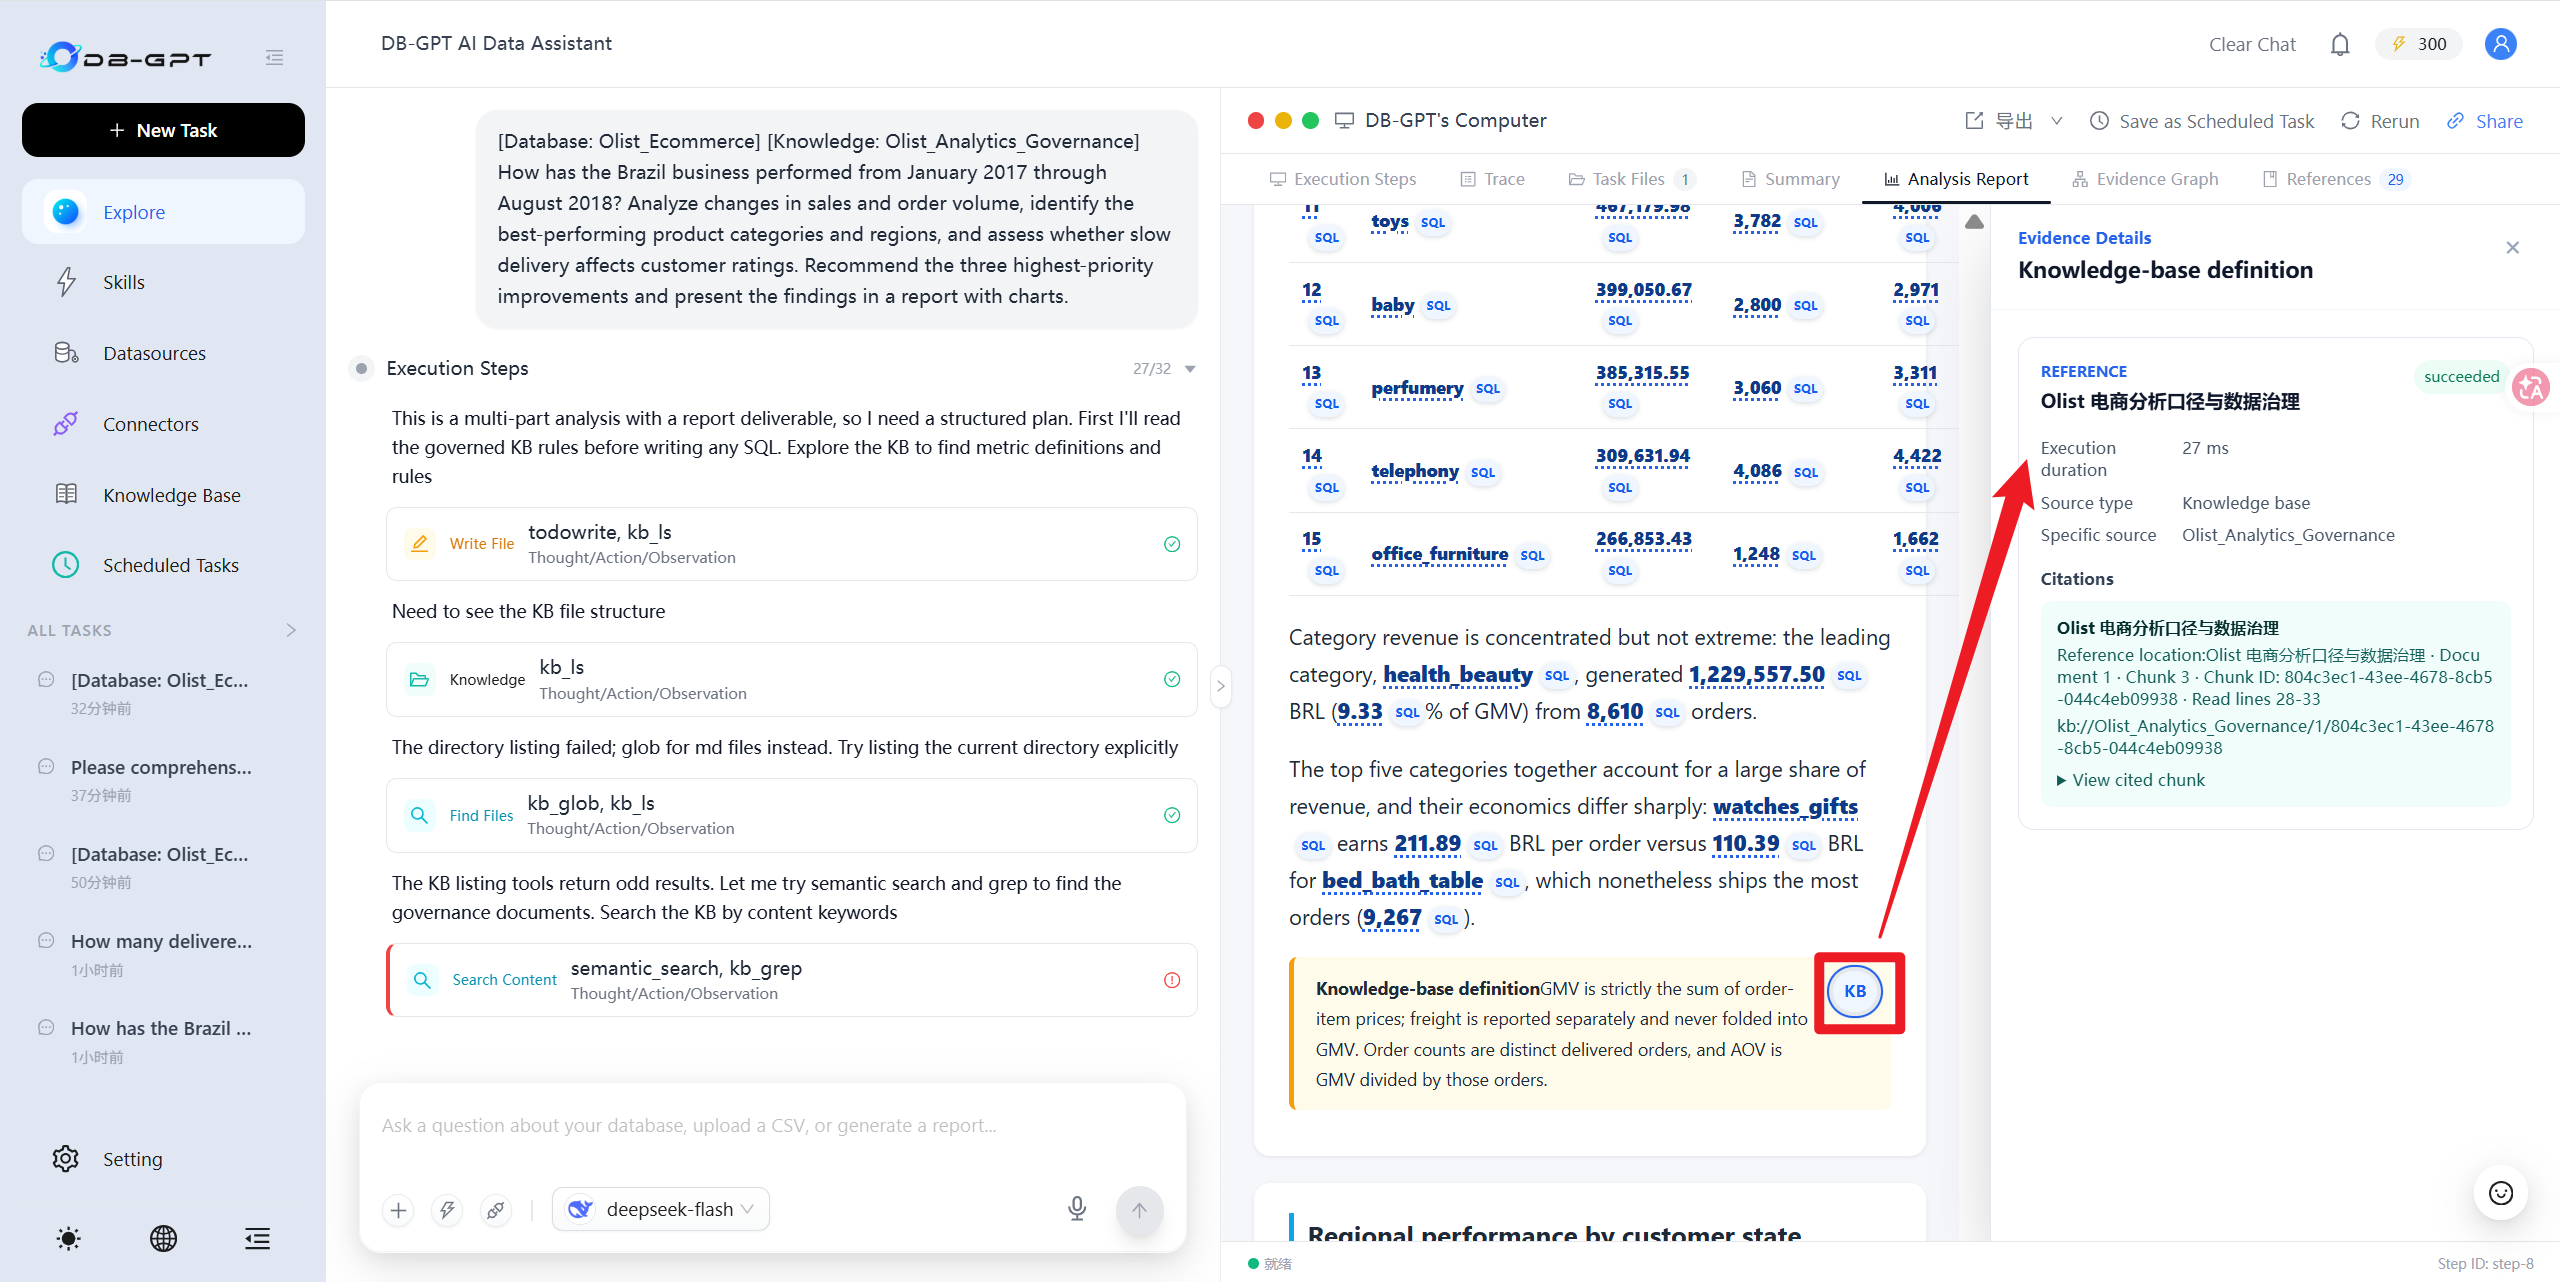
Figure 6. Following a methodology note to the knowledge-base source
Step 4: Compare Categories and Trace Chart Data
The user continues to the category analysis, first identifying the main sales categories from the bar chart and then reviewing the detail table below it. To verify the visualization, the user clicks the chart badge, and the source panel shows the SQL result and chart artifact behind the chart. The user can then check that categories, values, ordering, and units agree before deciding which categories merit deeper analysis or operational priority. See Figure 7.
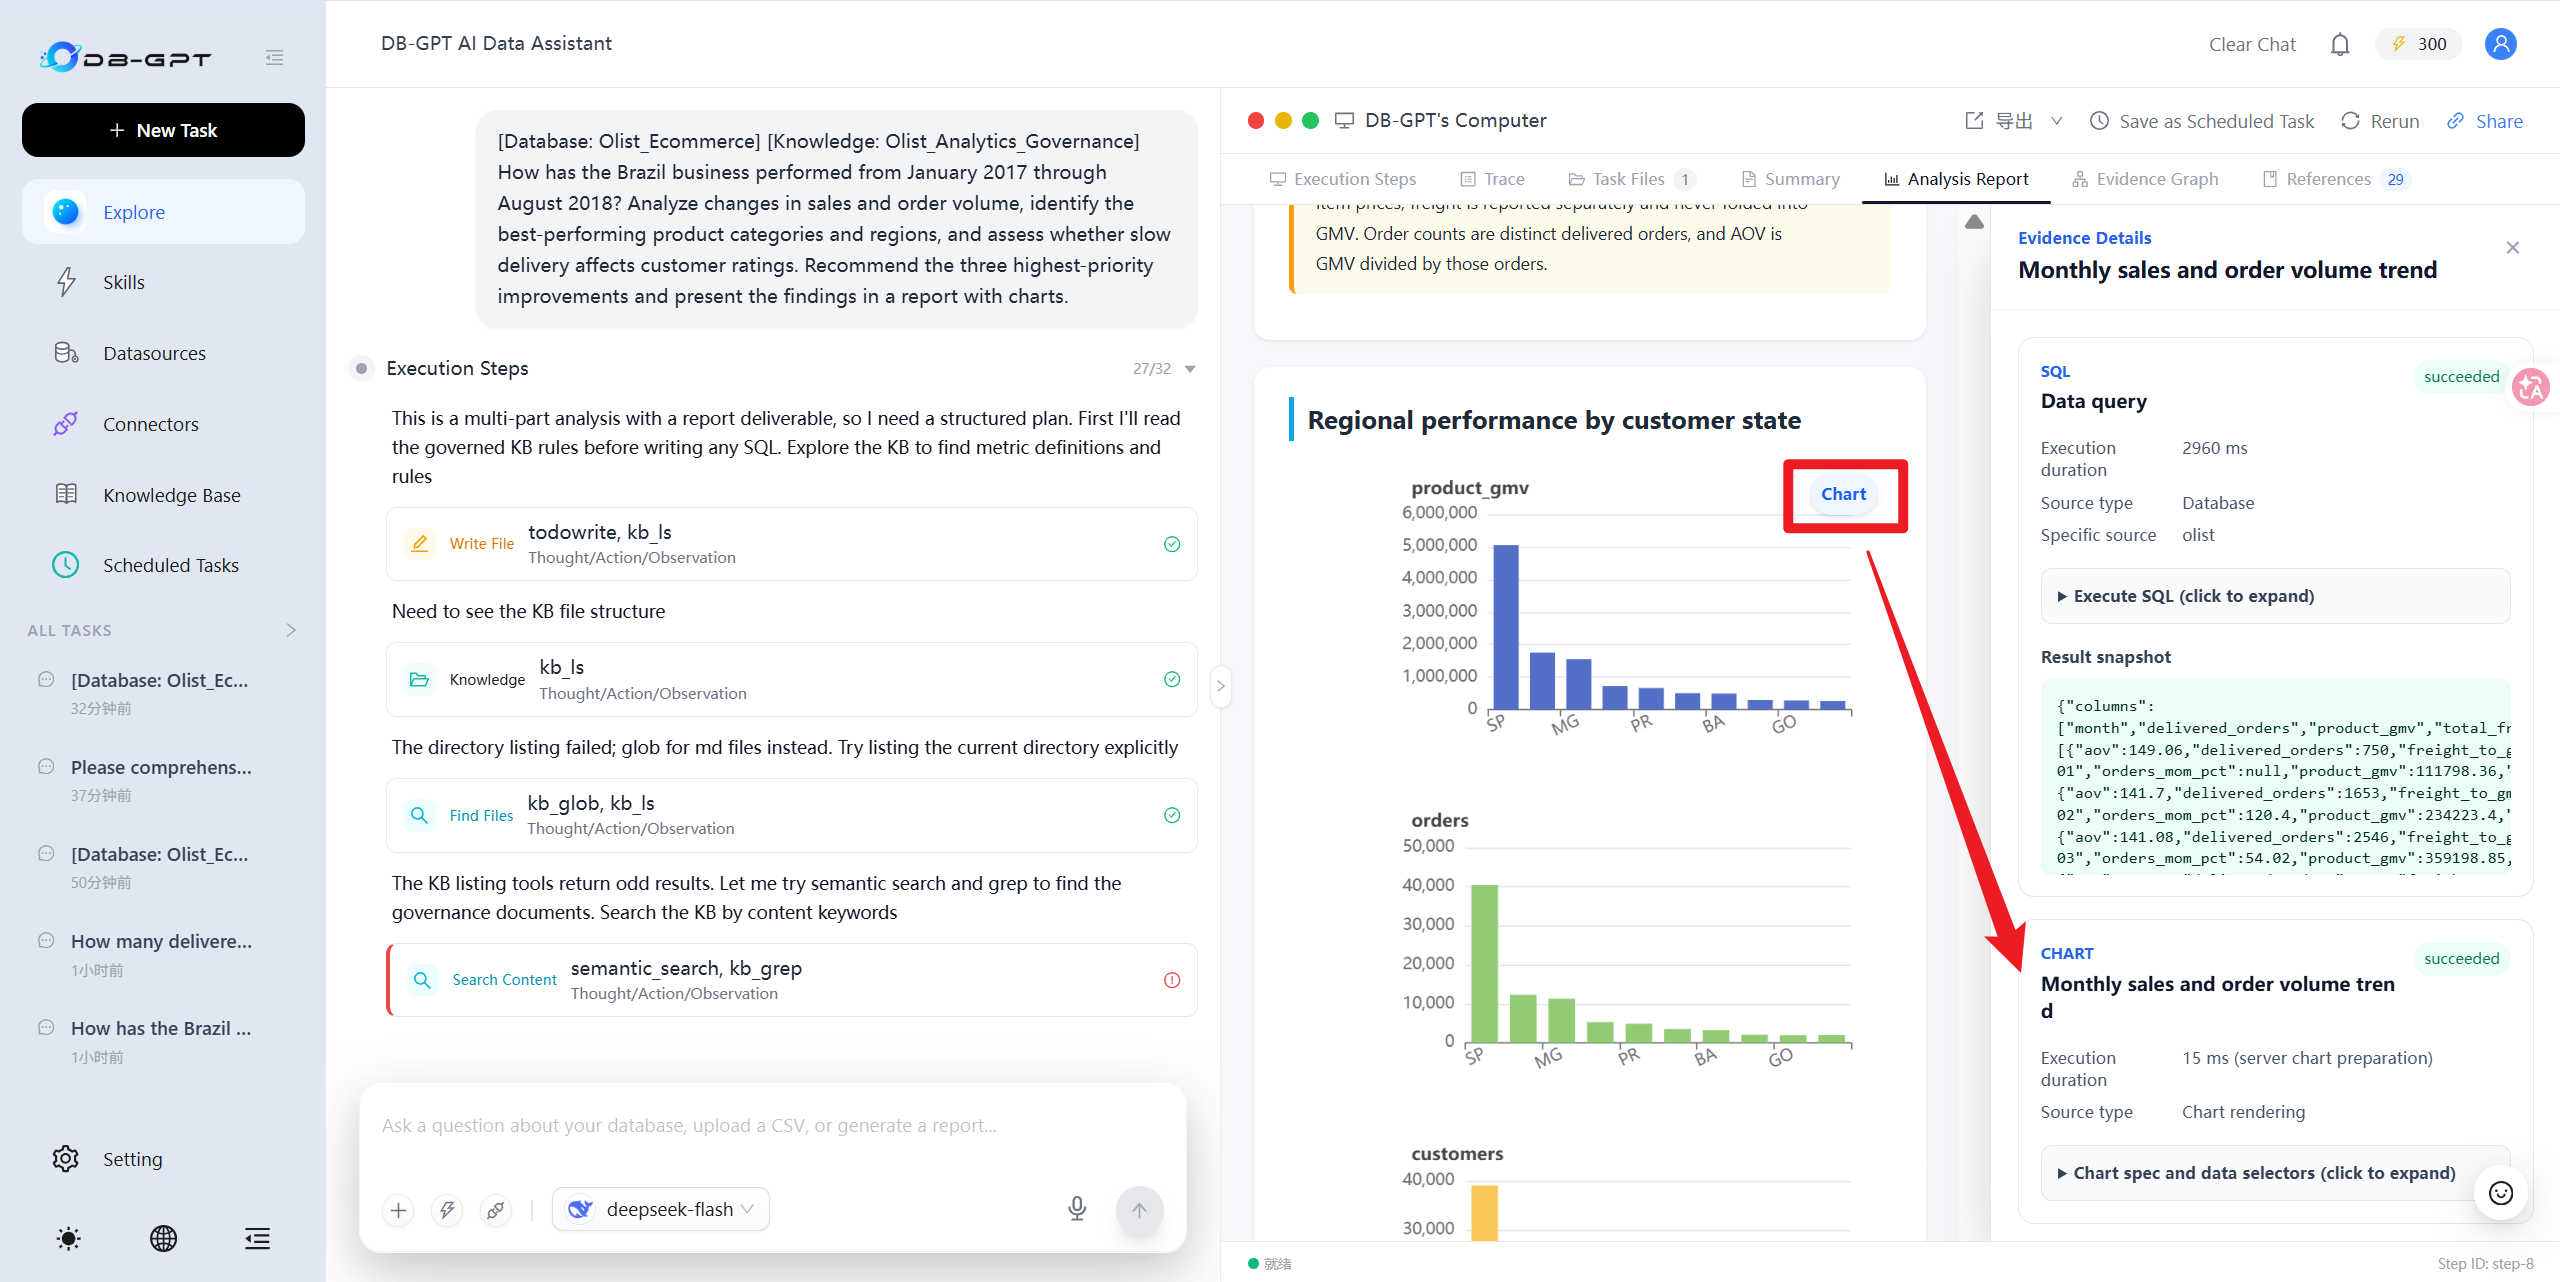
Figure 7. Inspecting query results and chart artifacts from a category chart
Step 5: Review Metrics Computed by Python
For statistics computed in Python, the user clicks the PY badge next to the body value to inspect the executed code, result snapshot, and input files. Verification starts with the referenced field, then checks grouping, quantiles, or other computation steps, and opens the input file when the data source needs confirmation. This lets the user trace a specific value in the report back to its calculation basis, as shown in Figure 8.
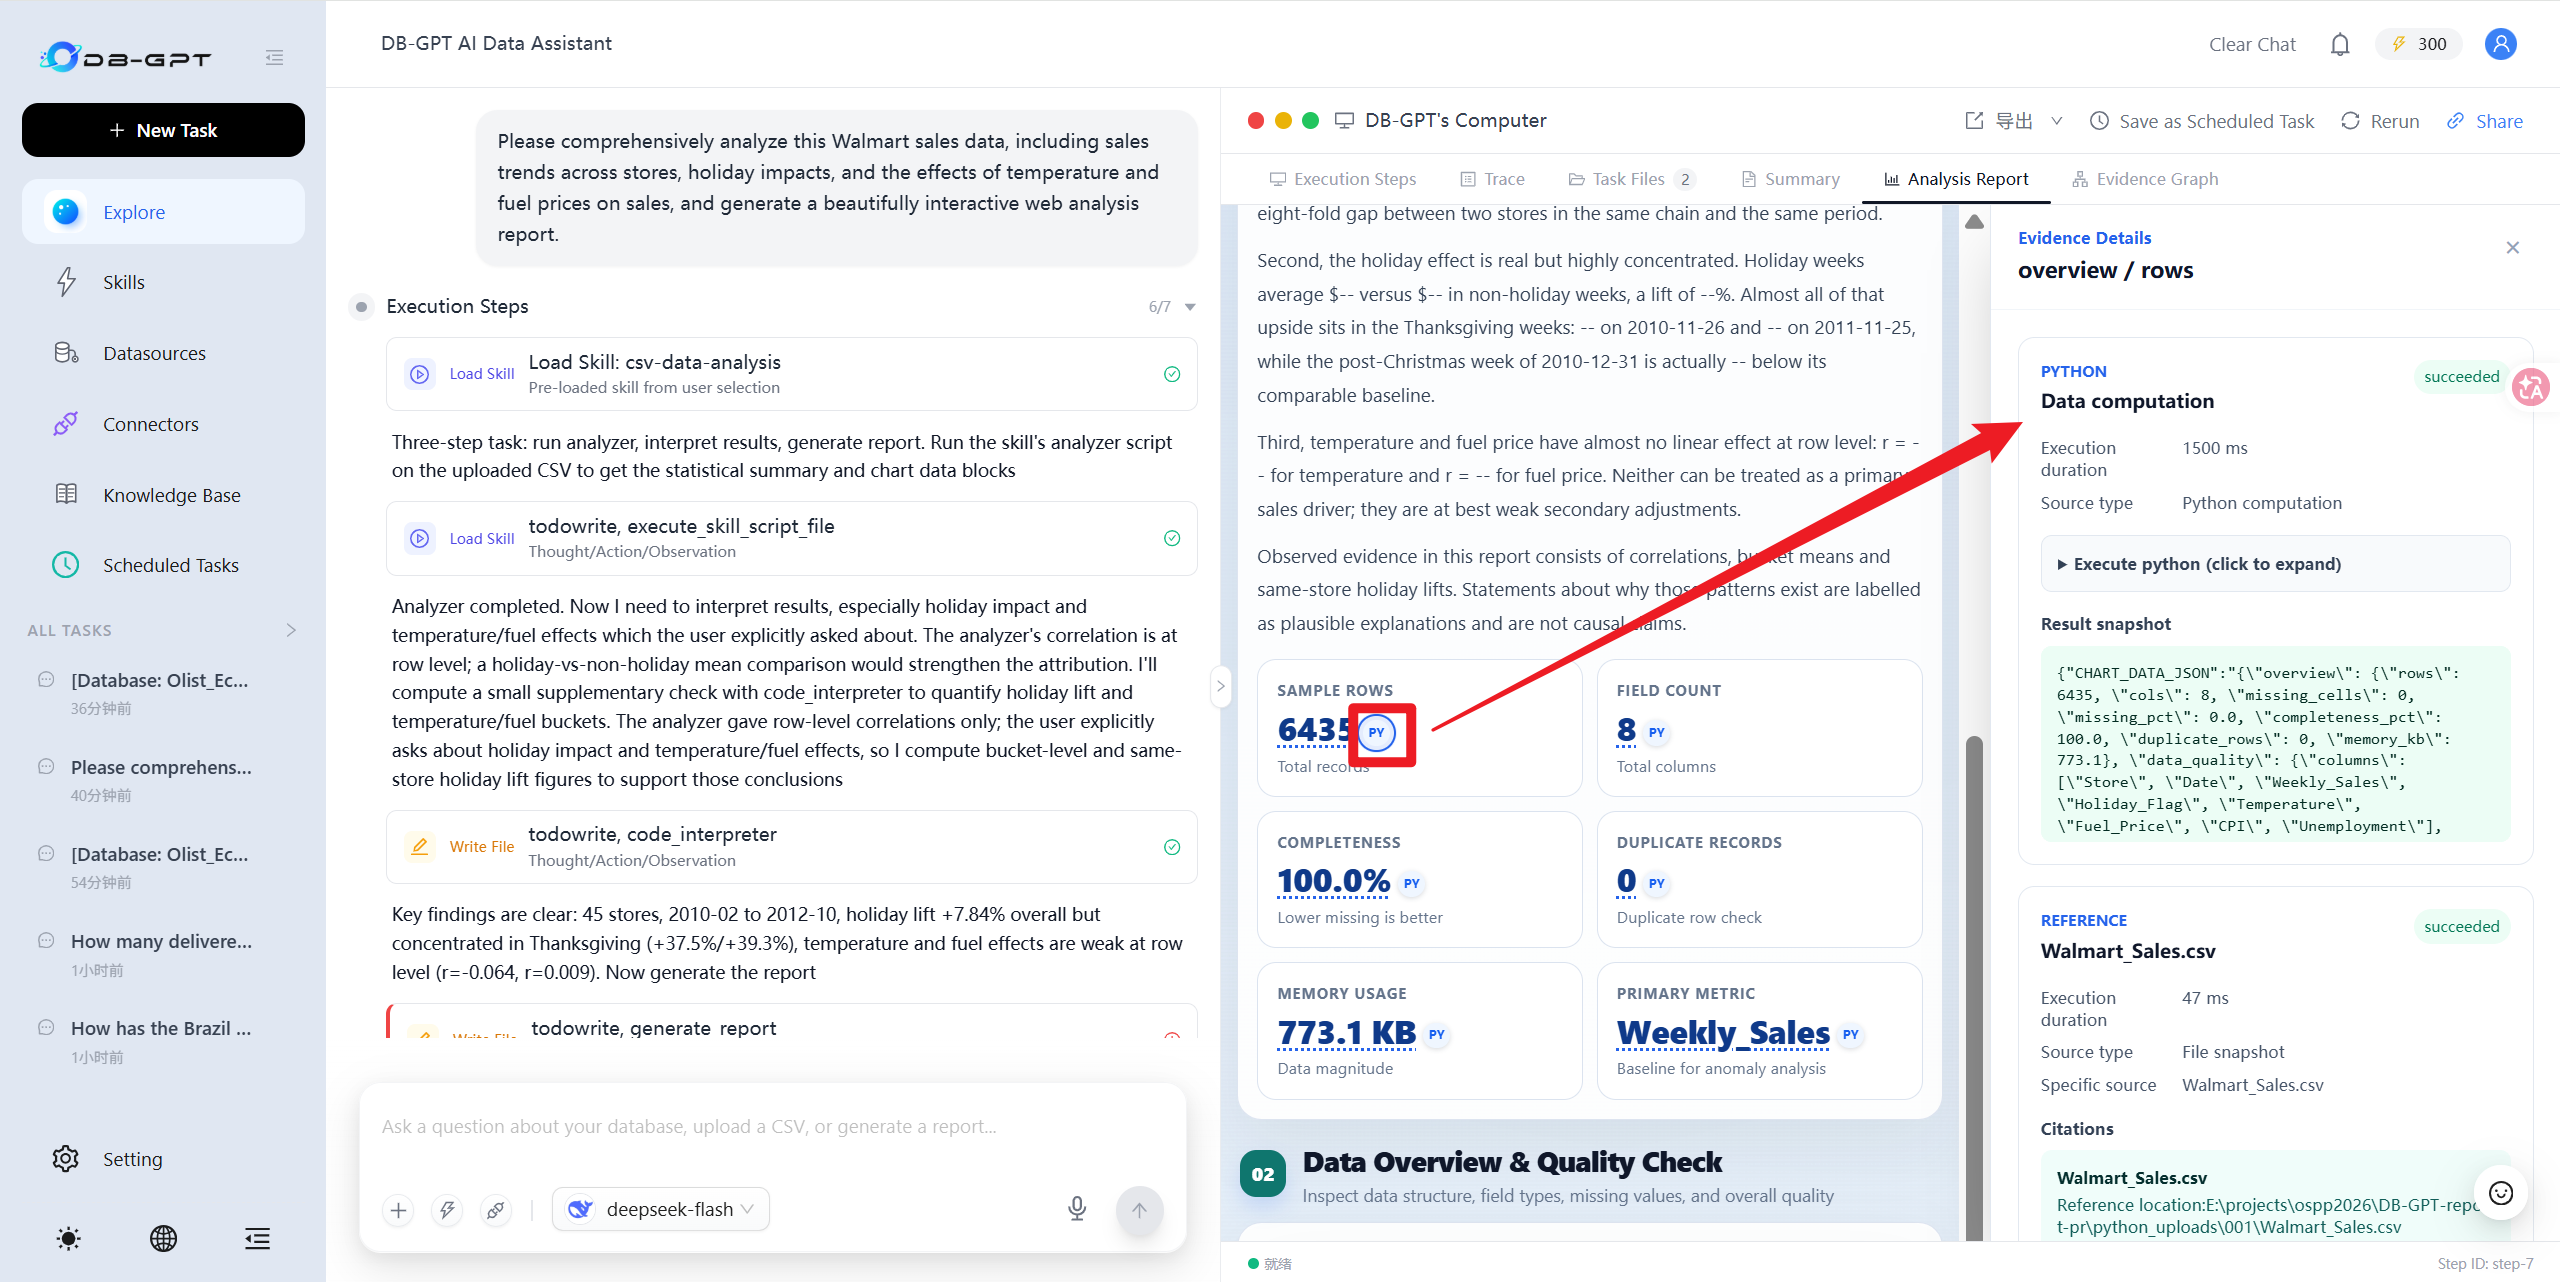
Figure 8. Tracing a body value back to Python computation and input files
Step 6: Compare Numeric Results with Business Rules
For important metrics, the user expands both the SQL result and the knowledge-base source and reviews the computed value together with the rule that should apply. For example, the user checks the result field used for GMV, whether orders are deduplicated, and whether multi-table joins aggregate at the correct grain. When a value is unexpected, these details help the user decide whether to adjust the query, the metric definition, or the report wording. See Figure 9.
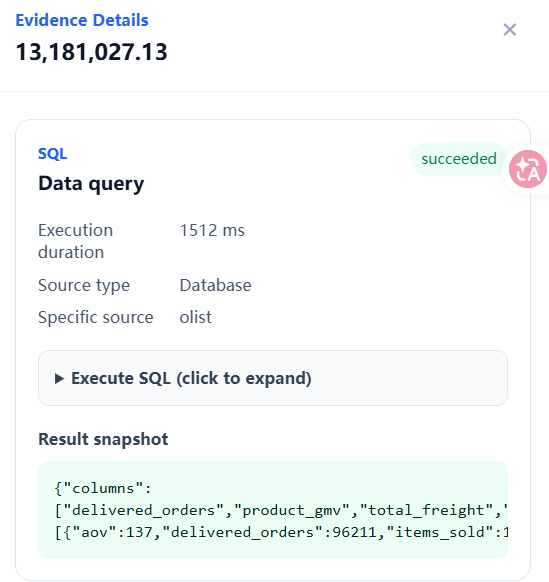
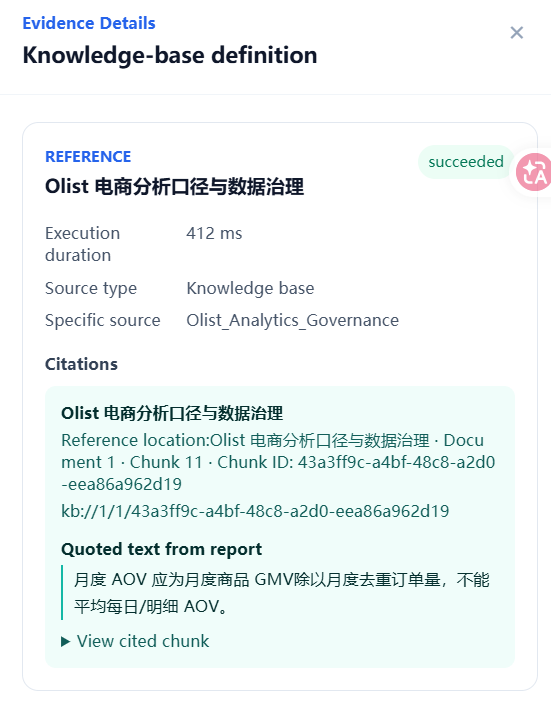
Figure 9. Comparing a SQL result snapshot with the knowledge-base source
Step 7: Inspect the Full Source and Execution Chain
After local verification, the user switches to Evidence Graph, reviews databases and knowledge files in the left column, follows the execution steps in the middle to understand the analysis, and checks report and chart files on the right. Clicking a node opens details with execution status, results, or file information. This shows which materials the report depends on and helps locate failed or still-questionable steps. See Figure 10.
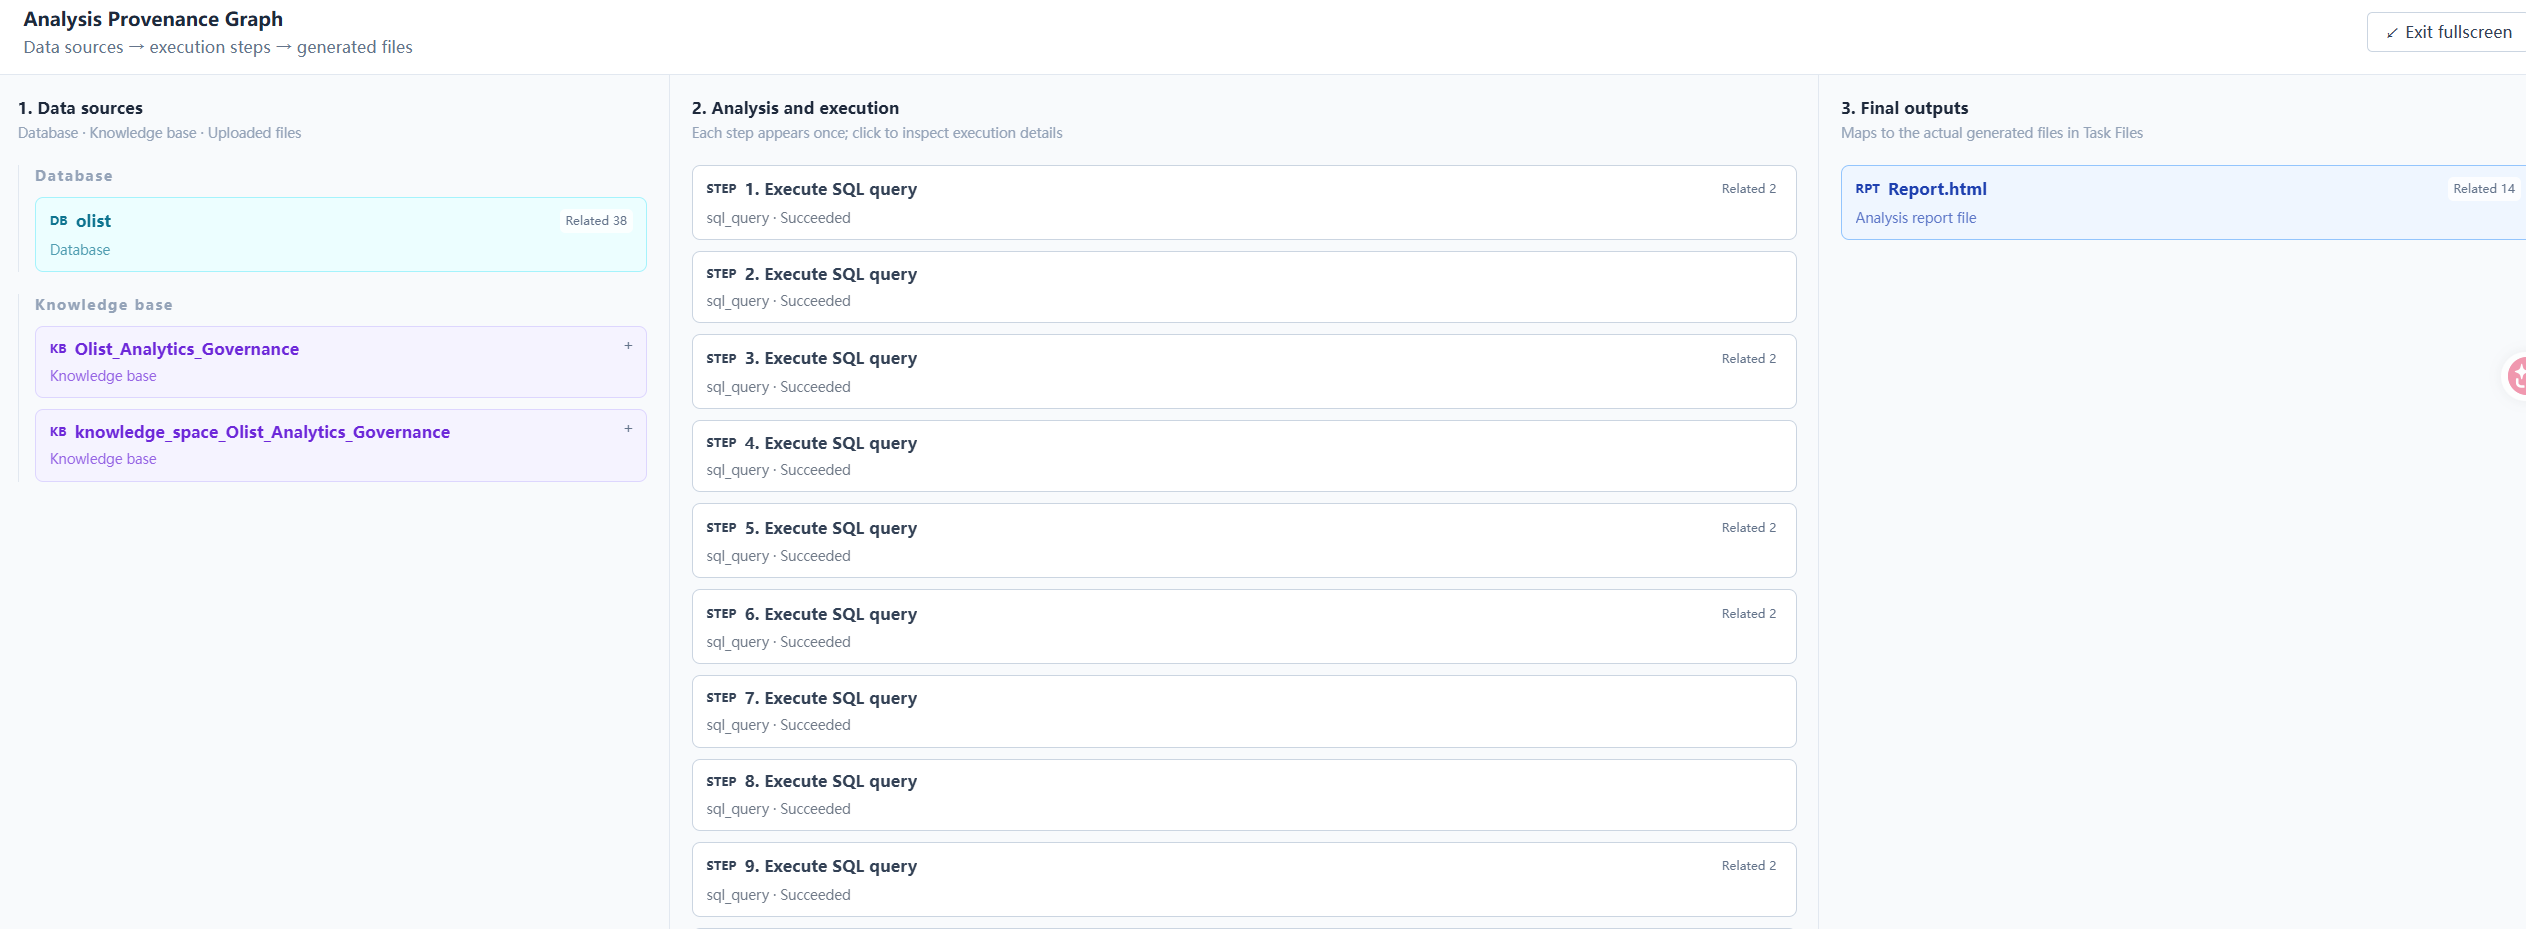
Figure 10. Inspecting the complete chain from sources to execution and output files
Step 8: Choose the Report Delivery Format
When verification is complete, the user returns to Analysis Report and opens the Export menu in the upper-right corner, choosing HTML or PDF for the intended audience. Choose HTML for an offline-readable web page, or PDF for printing or archiving. Work that still needs interactive charts and source details should continue in the online report. See Figure 11.
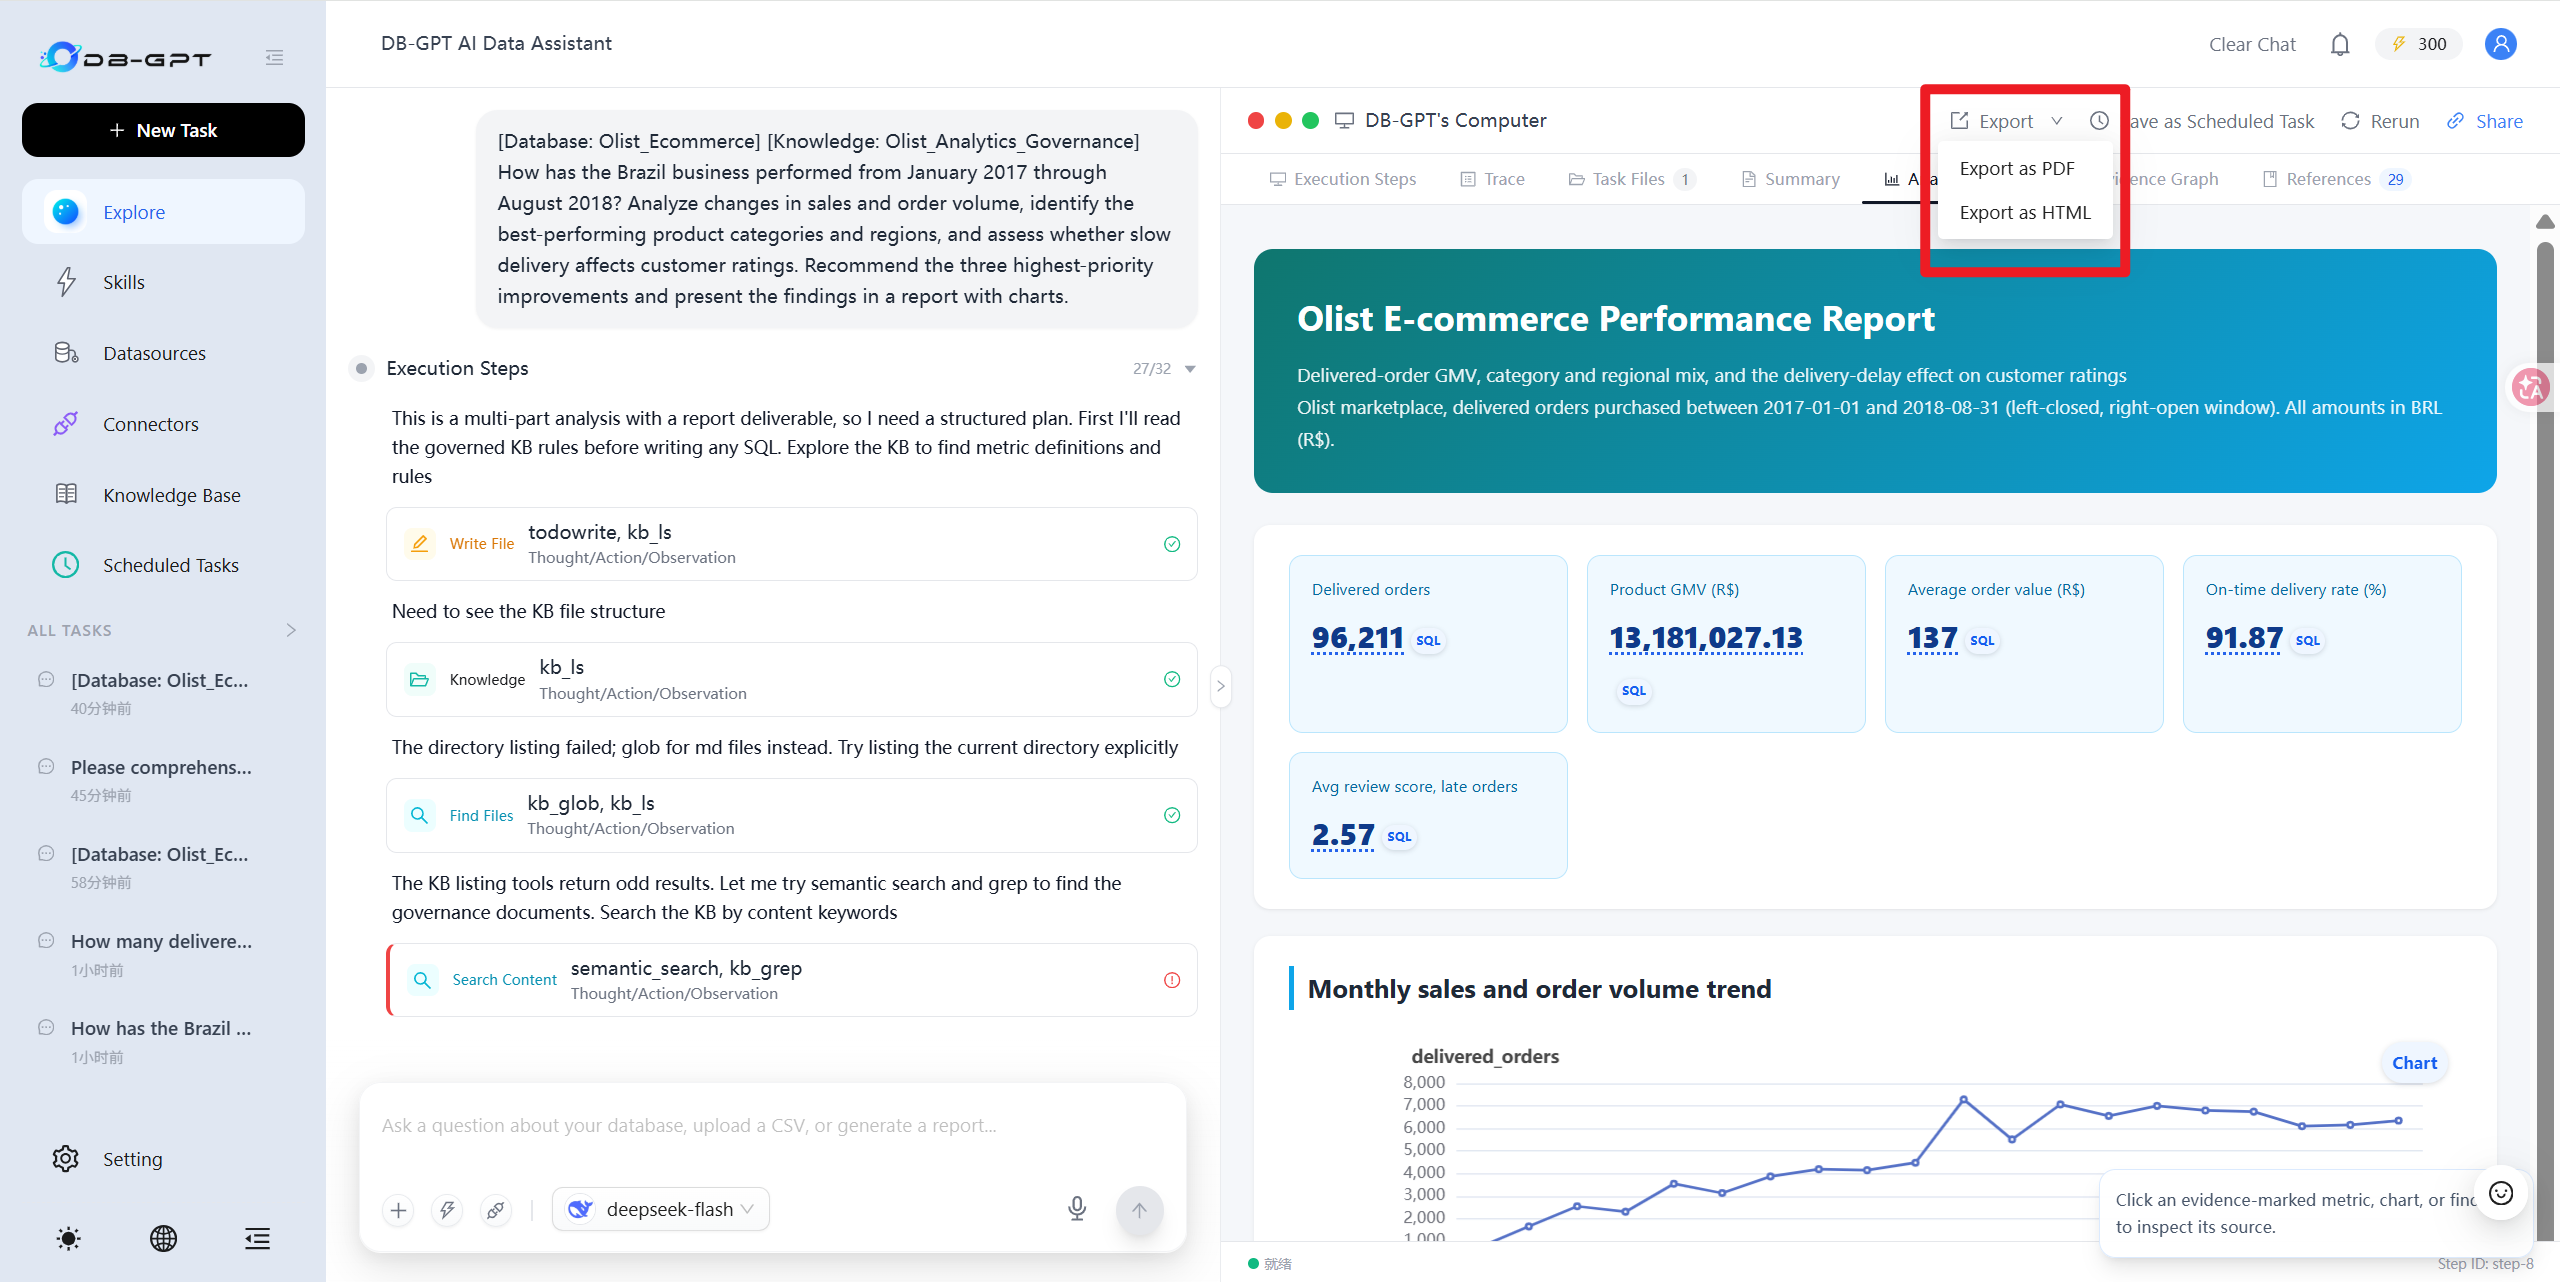
Figure 11. Choosing HTML or PDF from the report export menu
Step 9: Check the Print Layout and Save as PDF
After choosing Export as PDF, the user enters the browser print preview and checks pagination, table width, charts, and font rendering, adjusting orientation, scale, and background graphics as needed. Once key content is confirmed not to be clipped, the user saves the PDF and completes delivery. The preview step lets the user verify the final reading experience before sending the file. The print snapshot uses a bounded paint wait so focusing the print popup cannot leave the export stuck on an empty tab. See Figure 12.
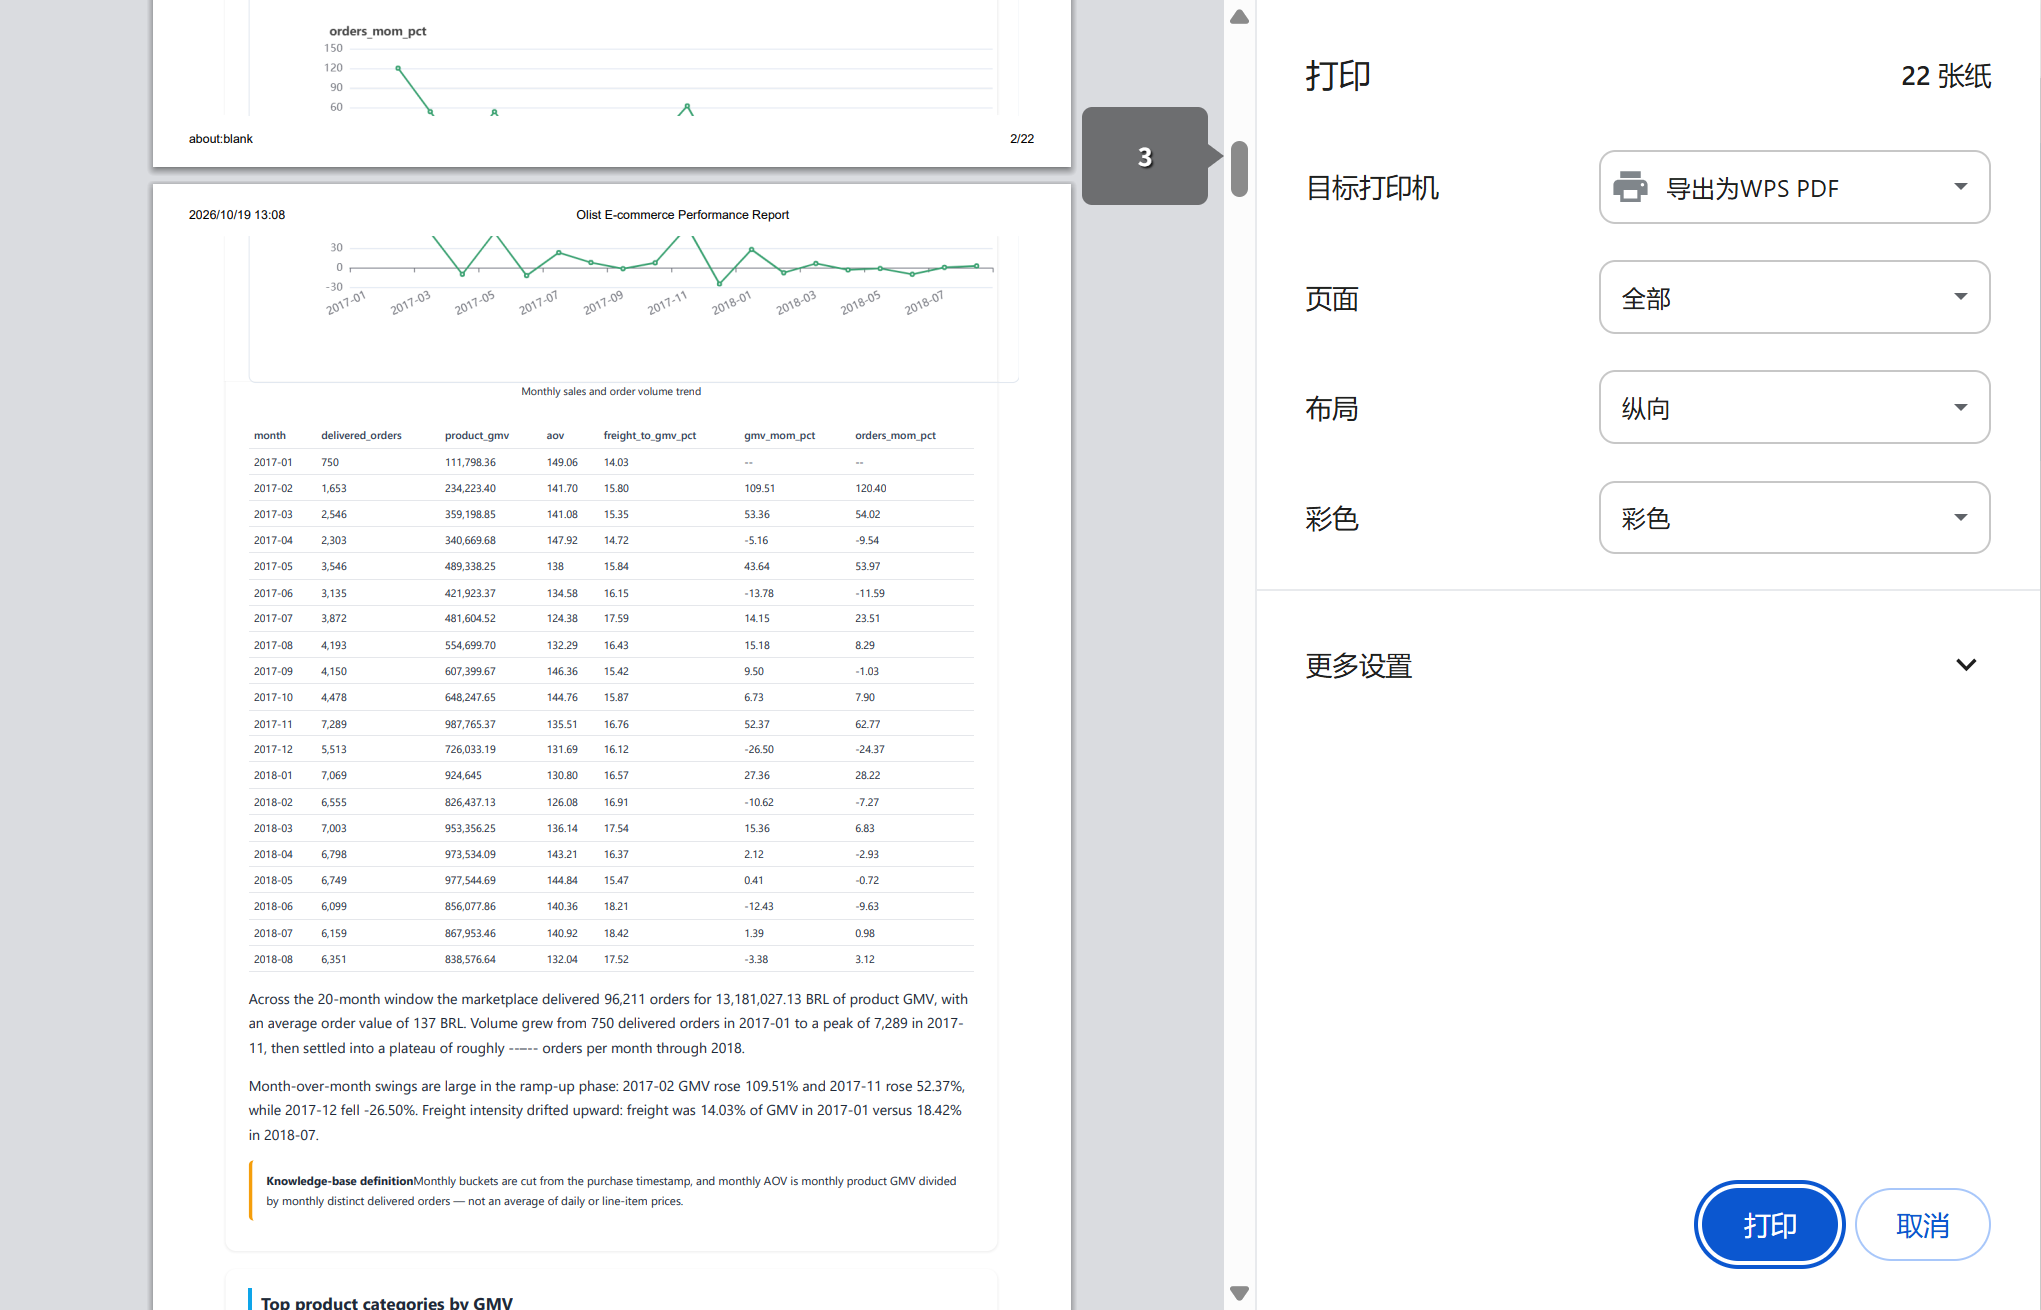
Figure 12. Checking pagination in print preview and saving as PDF